
Refer to the exhibit. What is the purpose of the blue sphere?
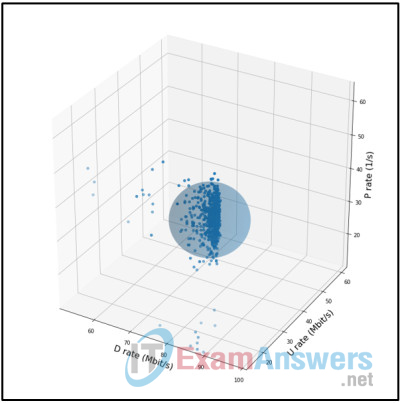
- to display the mean
- to indicate data clusters
- to measure true error
- to categorize historical data
Explanation: A scientist must calculate a decision boundary to detect anomalies. Anomalous data points are points that lie beyond the decision boundary sphere.
Exam with this question: Big data & Analytics Chapter 4 Quiz Answers – Advanced Data Analytics and Machine Learning
Please login or Register to submit your answer