3.1.3.7 Lab – Using Excel to Forecast Answers
Objectives
- Input Data into a spreadsheet
- Execute a Data Forecast
Background / Scenario
Forecasting is a way of predicting values in the future based on data. Managers wants data instantly in order to make decisions and they rely on techniques such as forecasting to make those decisions. With big data, volumes of data is produced instantaneously. This presents a challenge to collect and process this data in real time.
This lab is very basic and is designed to just show you how forecasting is performed in Microsoft Excel. You will be inputting a set of weekly grades and using the forecast feature to see what grades are predicted for the next few weeks.
Note: The Forecast menu option is available in the 2016 version of Excel. If you do not have this version, the formula is provided. You might do better copying the formula from the lab than inputting it.
Note: If you do not have the Forecast icon available in the Data menu option, but have the 2016 version of Excel, select the File menu option > Options > Add-Ins > Go > enable the checkbox beside Analysis ToolPak > OK. If you return to the File > Options > Add-Ins window, you should see the Analysis ToolPak in the top section where the active add-ins list.
Required Resources
- Microsoft Excel with the Analysis ToolPak option installed or ability to enable as an Add-In
Step 1: Input the Data
In this part, you will input grades and dates into specific Microsoft Excel cells.
a. Open Microsoft Excel.
b. In the A1 cell, type Date.
c. In the B1 cell, type Grade.
d. In the C1 cell, type Forecast.
e. In the D1 cell, type Lower Confidence Boundary.
f. In the E1 cell, type Upper Confidence Boundary.
g. Starting with the A2 cell, type the following dates in the A2 through A11 cells:
1/8/2018, 1/15/2018, 1/22/2018, 1/29/2018, 2/5/2018, 2/12/2018, 2/19/2018, 2/26/2018, 3/5/2018, 3/12/2018, 3/19/2018, 3/26/2018, 4/2/2018, 4/9/2018
Note: If you get pound signs (###) in your cell, click, hold down, and drag the line to the right of the dates to make the A column bigger or you can right-click the A that is above the word “Date,” select Column width, type 10, and click OK.
h. Starting with the B2 cell, type the following grades in the B2 through B11 cells:
100, 90, 75, 80, 50, 95, 85, 100, 80, 75
Step 2: Execute a Data Forecast
In this part, you will use Excel to forecast what your grades will be for the remaining weeks. Remember that this forecast is based on what the grades you have already made.
a. Use the forecast sheet function. Click and hold to select cells A1 through B11 (all of the data where there is data in both the A and B columns).
Note: If you do not have the 2016 version of Excel, skip to Step 2g.
b. Select the Data menu option > Forecast Sheet.
Note: If you do not have the Forecast icon available in the Data menu option, but have the 2016 version of Excel, select the File menu option -> Options -> Excel Add-Ins -> Go -> enable the checkbox beside Analysis ToolPak > OK. If you return to the File > Options > Add-Ins window, you should see the Analysis ToolPak in the top section where the active add-ins list.
c. In the Forecast End calendar window, select 4/9/2018 as the end date.
d. Expand the Options area by clicking once on the arrow beside the word “Options.” Notice that you can adjust the confidence interval (the upper and lower limits of what Excel predicts you will score in the next few weeks).
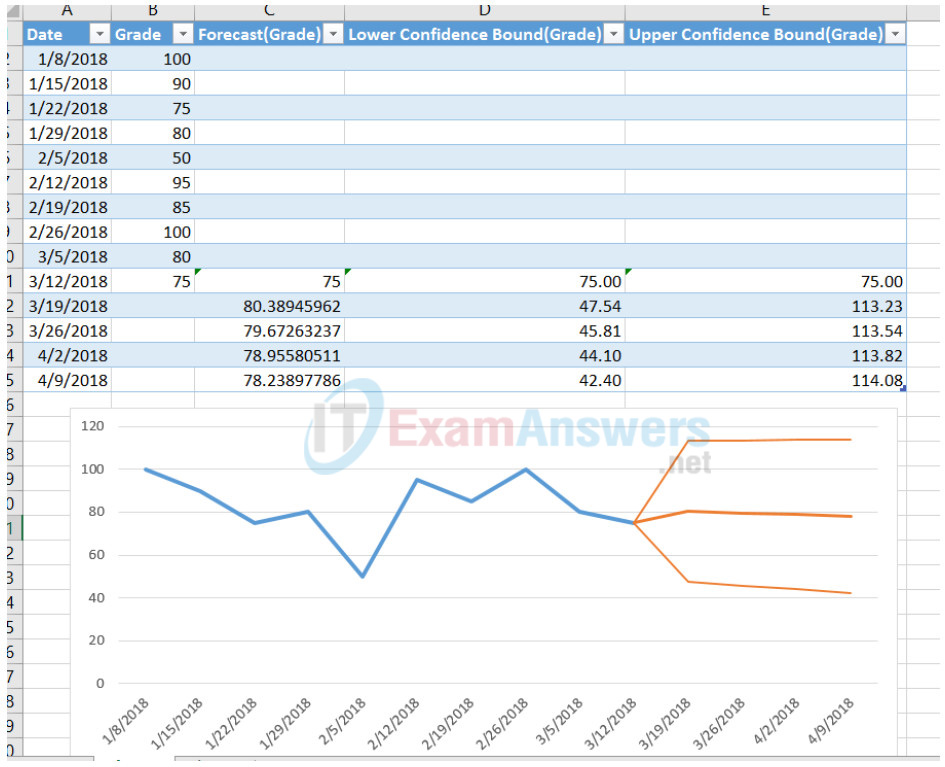
e. Click the Create button. The window and graph shown should be similar to what is shown. Note that the graph was moved below the data just to capture the screen.

f. Notice that Excel predicts that you will make 80.39 on March 19th, but is 95% confident that it really will be a score somewhere between 47.54 and 113.23.
What score is predicted for April 2nd? _____
Within what range of scores is Excel 95% confident that you will make on April 9th? _________________
g. If you do not have the 2016 version of Excel or if you just like using a formula instead of the using the menu, you can input a formula and get the same numbers.
In C12 enter the following formula:
=FORECAST.ETS(A12,$B$2:$B$11,$A$2:$A$11,1,1)
In D12, enter the following formula:
=C12-FORECAST.ETS.CONFINT(A12,$B$2:B$11,$A$2:$A$11,0.95,1,1)
In E12, enter the following formula:
=C12+FORECAST.ETS.CONFINT(A12,$B$2:B$11,$A$2:$A$11,0.95,1,1)
Part 2: Modify the data.
a. Change the data to grades that are more reflective of your own grades.
b. Change the confidence level to 98%.
How did changing the confidence level from 95% to 98% affect the forecast range of grades?
_______________________
List three examples of where you think forecasting would be used in big data.
_______________________
