6.2.4.4 Packet Tracer – Threat Modeling to Assess Risk in an IoT System (Instructor Version)
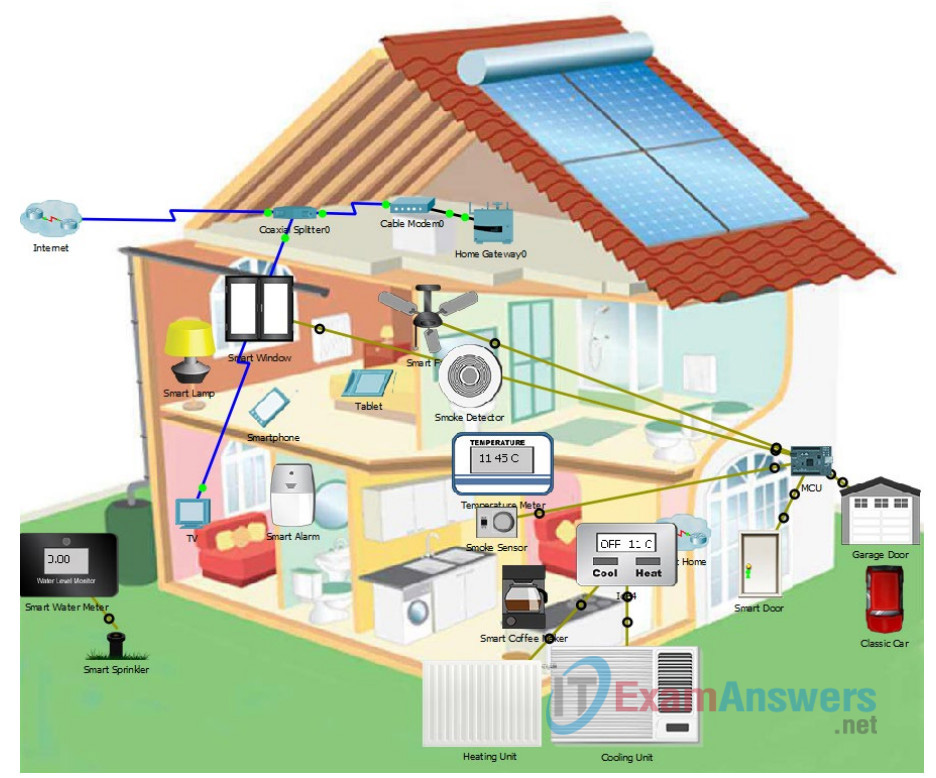
Topology
This is a home IoT system that has been prototyped in Packet Tracer. It shows a cutaway view of a home with different sensors, actuators, and connections shown.

Objectives
- Part 1: Creating a Data Flow Diagram of the Home IoT System
- Part 2: Creating a Risk Assessment using DREAD
- Part 3: Selecting a Risk Response for the Rated Risks
- Part 4: Considering Risk Mitigation Strategies
Required Resources
- Packet Tracer 7.1 or later
Background/Scenario
In this Packet Tracer, you will complete your threat model of the IoT home automation system that you have worked with in previous chapters. Now that you have worked with all three layers of the IoT attack surface, you can create a basic data flow diagram of the system. This will help you to understand the system at a functional level and create trust boundaries that will help with understanding security risks. Normally, the data flow diagram would be completed in Step 2 of the threat modeling process. However, because of the structure of this course, you need to do it later, after all of your asset inventories of the three attack surface layers have been completed.
You will use your STRIDE tables from the physical, communication, and application layers of the IoT attack surface and apply the DREAD model to create risk metrics for some of the threats. Normally, a threat model would include risk metrics for all of the relevant threats that have been identified, however, for the sake of time, you will work with only some of them.
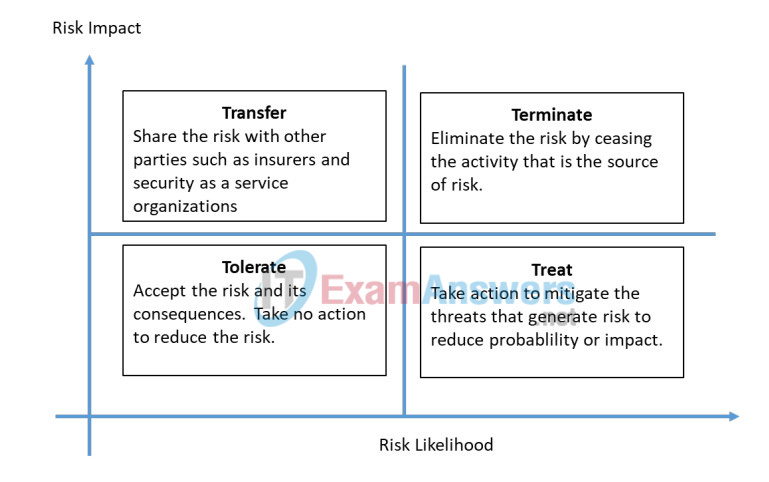
After creating the risk metrics, you will decide how to respond to the risks using the four Ts risk response model.
Part 1: Creating a Data Flow Diagram of the Home IoT System
You have completed your asset inventories in previous Packet Tracers. You have also completed diagrams of the physical network, including the connections between devices and the types of protocols in use. Now you need to create a high level data flow diagram. This process is adapted from the Microsoft IoT Security Architecture.
Follow the model data flow diagram and process provided in the course content and do the following:
a. Think about the possible zones in the system. Create a zone for the sensors and actuators, the communication infrastructure device, and the cloud application. Think about the data stores and processes that could exist as cloud services. Connect these zones with arrows to indicate the type of communication between them.
b. What external entities access the system? Add the entities and lines to connect them to the zones that they have access to and the system they access. Think of the types of applications and protocols that each use, as well as the functions described in previous Packet Tracers.
c. Draw trust boundaries. Follow the definition of trust boundaries provided in the course.
Part 2: Creating a Risk Assessment using DREAD
In the three previous threat modeling Packet Tracers, you created device inventories and identified vulnerabilities in them using the STRIDE model. The next step is to use a scoring mechanism that allows you to determine and prioritize risk. The DREAD system lets you do this by creating a composite risk metric that consists of scores for the five DREAD risk categories:
- Damage potential – What is the degree of impact on the organization’s assets? (1 = low impact, 3 = high impact)
- Reproducibility – How easily can a variety of threat actors reproduce the attack? (always 3 – easy)
- Exploitability – How easy is the attack to execute? (1 = difficult, 3 = easy)
- Affected Users – Who and how many users will be affected? (1 = few, 3 = many)
- Discoverability – How easily can the vulnerability be found? (always 3 – easy)
For the purposes of this Packet Tracer, make the following assumptions. First, because this is a home automation system, assume that all members of the family that live in the home will be affected by any exploit. In addition, it is recommended that the reproducibility and discoverability metrics always be rated as high. Therefore, the metrics Reproducibility, Affected Users, and Discoverability metrics have already been scored as 3 for all vulnerabilities.
In an actual risk assessment, the A metric would not be assumed to be 3. However, it is recommended that R and second D always be rated 3.
a. Use the following table to grade your previously discovered threats according to the scoring explanation shown above. Normally, every relevant identified threat would be rated. However, for the purposes of this Packet Tracer, you can choose several threats from each of the three elements of the IoT attack surface that we have discussed in this course.
| Attack Surface and Threat | D | R | E | A | D | Total |
|---|---|---|---|---|---|---|
| Impersonate someone who is not, smartphone | 3 | 3 | 3 | 3 | 3 | 15 |
| Falsify data, Home Gateway | 3 | 3 | 1 | 3 | 3 | 13 |
| Successfully inject falsified data into the system | 3 | 3 | 1 | 3 | 3 | 13 |
| Pretend you made a transaction or operation, MCU | 2 | 3 | 2 | 3 | 3 | 13 |
| Power off devices or damage devices, MCU | 3 | 3 | 3 | 3 | 3 | 15 |
| Access resource privileges intended only for administrators or superusers | 3 | 3 | 3 | 3 | 3 | 15 |
| Fraudulent cables, Coaxial Splitter | 1 | 3 | 3 | 3 | 3 | 13 |
| Malicious Browser Extensions, Tablet or Smartphone | 1 | 3 | 3 | 3 | 3 | 13 |
| Fake updates, Home gateway | 1 | 3 | 1 | 3 | 3 | 13 |
| Programs and files downloaded from the Internet are a very important source of threats | 3 | 3 | 2 | 3 | 3 | 14 |
| Routers with home automation security | 1 | 3 | 1 | 3 | 3 | 11 |
b. Put the risks in order by the highest to lowest DREAD metric and estimate the likelihood that the risk will occur. Do this by copying the risks over, or by marking up the table that you completed above. Score the likelihood as 1 for unlikely and 3 for very likely.
| Attack Surface and Threat | Total | Likelihood |
|---|---|---|
| Impersonate someone who is not, smartphone | 15 | 3 |
| Power off devices or damage devices, MCU | 15 | 3 |
| Access resource privileges intended only for administrators or superusers, Modem | 15 | 3 |
| Programs and files downloaded from the Internet are a very important source of threats | 14 | 2 |
| Successfully inject falsified data into the system | 13 | 2 |
| Malicious Browser Extensions, Tablet or Smartphone | 13 | 3 |
| Routers with home automation security | 11 | 3 |
Part 3: Selecting a Risk Response for the Rated Risks
Refer to the four risk treatments in the graphic below or in the PDF version of these Packet Tracer instructions. According to your risk ratings and likelihoods, decide how the risks should be handled.

| Threat | Risk Response |
|---|---|
| This is done from the point of view of the attacker. | focused on attack |
| This focuses on classifying assets and assigning value to them. | asset centric |
| These allow sensor data to be sent over the IP network They can also allow traffic to be controlled to the actuators. | IoT gateways |
| Analyze the architecture system to identify threats to different elements. | focused on defense |
| hackers and predators | focused on attack |
| These allow user monitoring and control. from remote locations. | mobile applications |
What other factors should be considered when make a risk response determination besides the risk rating and likelihood?
There are some risks that we could consider as falsification and manipulation
Part 4: Considering Risk Mitigation Strategies
Finally, any risks that have been identified with a “treat” response need to be mitigated.
| Threat | Risk Response | Mitigation Strategy |
|---|---|---|
| computer viruses | focused on defense | antivirus |
| Identity fraud | focused on attack | Secure accounts and passwords |
| Spyware threats | focused on attack | Antivirus a way to mitigate |
