1.1.2.3 Lab – Demonstrate the Growth of Data with VNI (Instructor Version)
Objective
Demonstrate the growth of data using Cisco’s Visual Networking Index (VNI) web site.
- Part 1: Cisco VNI Forecast Widget
Background/Scenario
In this lab, you will access the Cisco VNI Forecast Widget to view network traffic growth trends over a five year period. You will select filters to limit or extend your search criteria.
Resources
- PC (OS X, Linux, Windows) with a connection to the Internet
Part 1: Cisco VNI Forecast Widget
Cisco has developed a forecast model to estimate future global IP traffic growth. The current Cisco VNI Forecast and Methodology 2015 – 2020 is based on Cisco analysis and independent analysts’ forecasts.
Note: Flash is required to view the graph in the Cisco VNI Forecast widget.
Step 1: Access Cisco’s VNI Forecast widget.
a. Navigate to Cisco’s VNI Forecast widget:
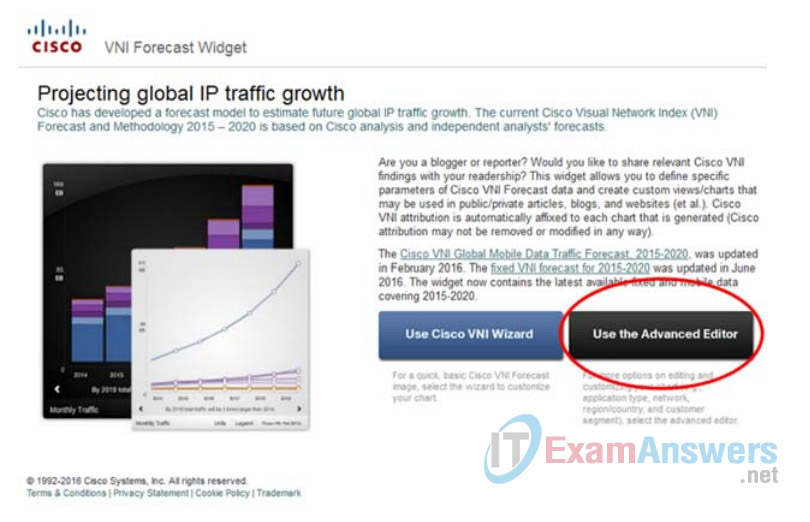
b. After reviewing the Projecting global IP traffic growth information, click Use the Advanced Editor button.
Step 2: Use the Advanced Editor to change filter settings.
The Advanced Editor allows you to filter the data by Application Type, Network Type, Segment, and Country & Region. You also have options to change the Chart Type, Date Range, and Graphic Theme.
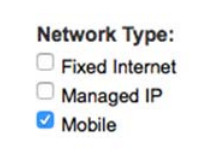
a. To view only Mobile data, remove the Fixed Internet and Managed IP checkmarks under Network Type.
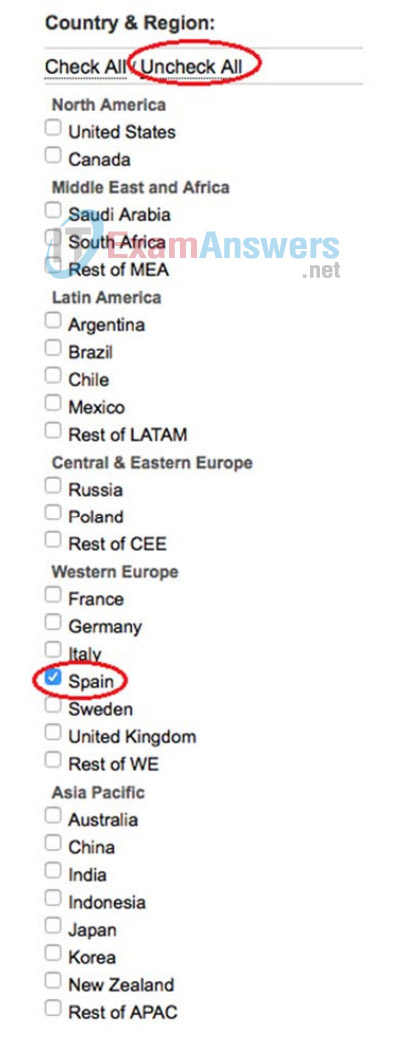
b. Click Uncheck All under the Country & Region section, and then check the Spain checkbox.
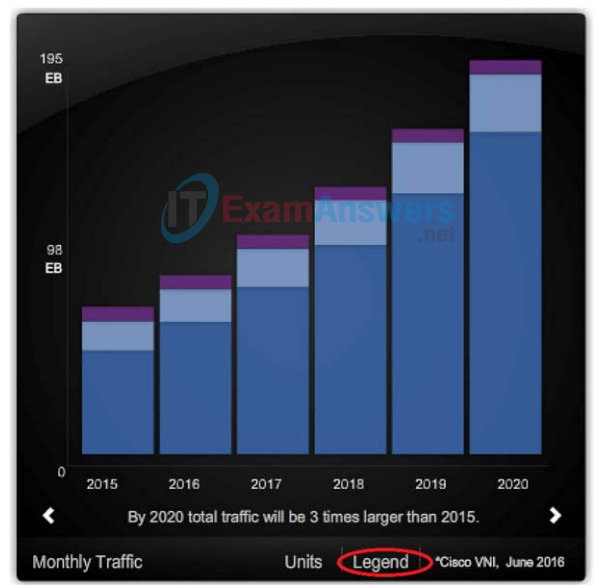
c. The bar chart on the right displays the growth of mobile (smartphones and tablets) data over the five-year span from 2015 to 2020. Click the Legend button to view the color coding legend of the bars. Click the Legend button again to hide the legend.
Define and sequence the following terms: Petabyte, Terabyte, and Exabyte.
- A terabyte (TB) is 1,000 gigabytes (GB).
- A petabyte (PB) is 1,000 terabytes (TB).
- A exabyte (EB) is 1,000 petabytes (PB).
How does Spain’s IP mobile traffic growth differ from your country’s growth?
Answers may vary.
Note: If you are interested in testing the speed between your device and your ISP, go to http://www.speedtest.net.
Part 2: Cisco Data Meter App
The free Cisco Data Meter app enables Apple and Android mobile device users to easily review their cellular and Wi-Fi data usage, test cellular and Wi-Fi connection speeds, and find nearby Wi-Fi hotspots.
Note: Part 2 is demonstrated using an Android device. Some screens and steps may be different when using an iOS or other device.
Step 1: Download the Cisco Data Meter App.
- a. Navigate to the App Store for your mobile device and search for the Cisco Data Meter app.
- b. Download and install the Cisco Data Meter app.
Step 2: Open and use the Cisco Data Meter app.
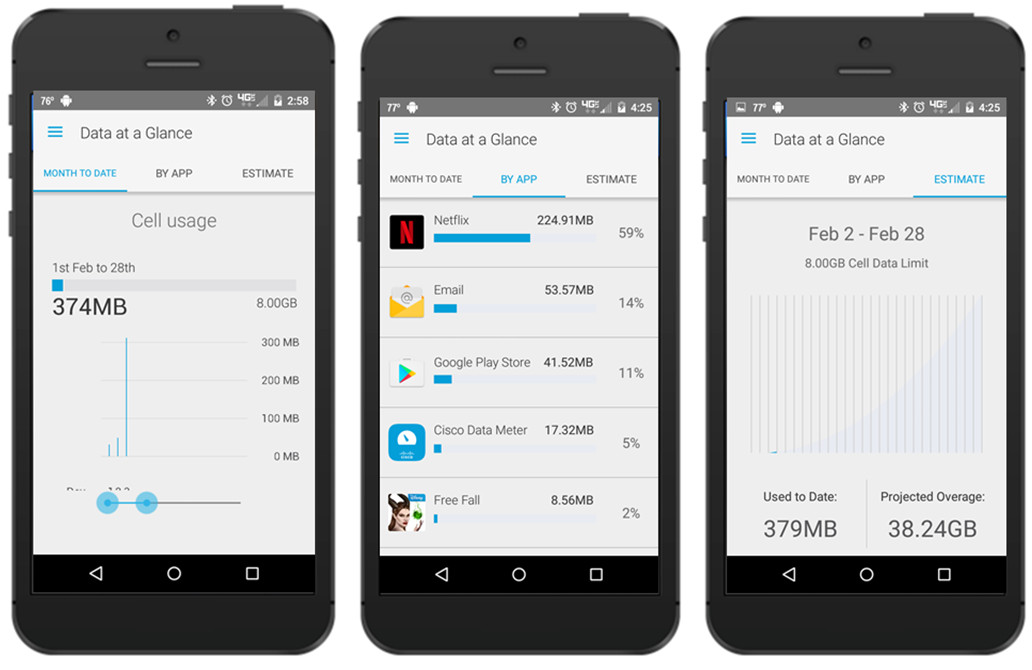
a. Open the Cisco Data Meter app. The Data at a Glance screen opens and displays the MONTH TO DATE cell usage. Swipe to the right. You may see the data usage BY APP or an ESTIMATE of how much data you may use for the month.
b. Touch the menu icon ( ) or swipe all way to the left for a list of options. Choose Performing Speed Test. Click RUN TEST to begin performing an active cell connection speed test. If you want to test the WI-FI connection, be sure WI-FI is enabled for your device.
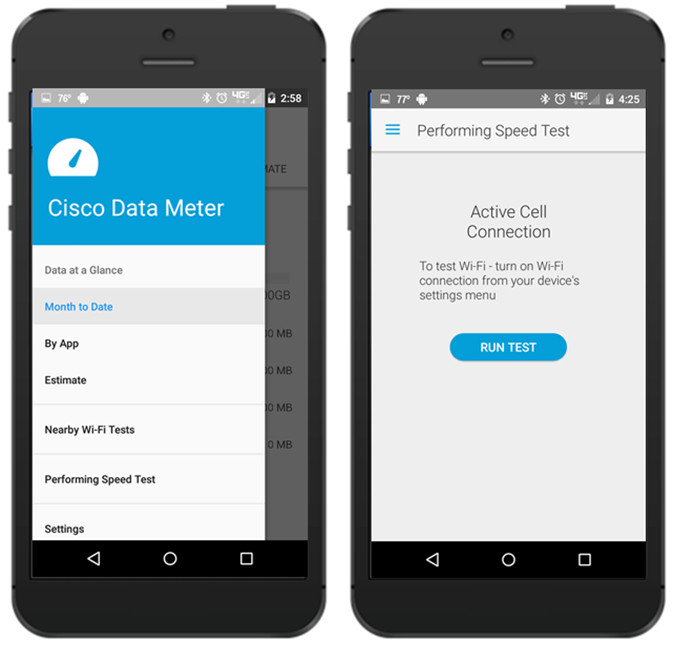
c. With WI-FI enabled, touch the menu icon ( ) or swipe all way to the left for a list of options. Select the Nearby Wi-Fi button to view a local map of available Wi-Fi networks in your area.
Reflection
Based on video growth trends shown in the VNI graph and the results from your Wi-Fi network test, do you feel that your current Wi-Fi network speed will be able to handle the expected additional traffic in 2020? Explain.
Answers may vary. Globally, IP traffic will grow threefold from 2015 to 2020. Part of that growth will be the result of increased demand for streaming video on mobile devices. Problems with network bottlenecks may occur due to incessant demand, which may require upgrades to new Wi-Fi network technologies.
