1.2.2.3 Lab – Explore Sources of Open Data (Instructor Version)
Objectives
Explore the different websites that provide openly available data.
- Part 1: Open Government Partnership
- Part 2: Open Data Websites
- Part 3: Data Visualization
Background/Scenario
Immeasurable amounts of data have been generated and stored. Data is useful only if it can be used to generate new knowledge. When data is made freely available for others to use, without intellectual property restrictions, this data is considered open data. Open data may require attribution to the original source. Derivations from the original work can also be designated as open data.
In this lab, you will explore several sources of open data. You will also explore the data visualization capability available on these websites to create insights based on facts.
Required Resources
- PC or mobile device with Internet access
Part 1: Open Government Partnership
The Open Government Partnership (OGP) was launched in 2011. The goal of the partnership is to create an international platform to create more open, accountable, and responsive governments for their citizens.
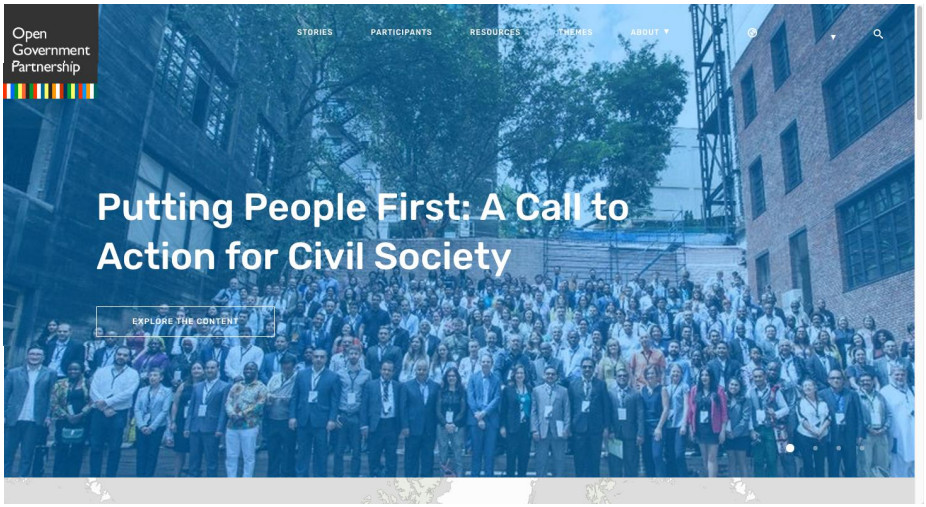
a. Navigate to www.opengovpartnership.org/ to find more information about OGP. (The photo you will see may vary.)
b. Click Participants at the top center of the screen.
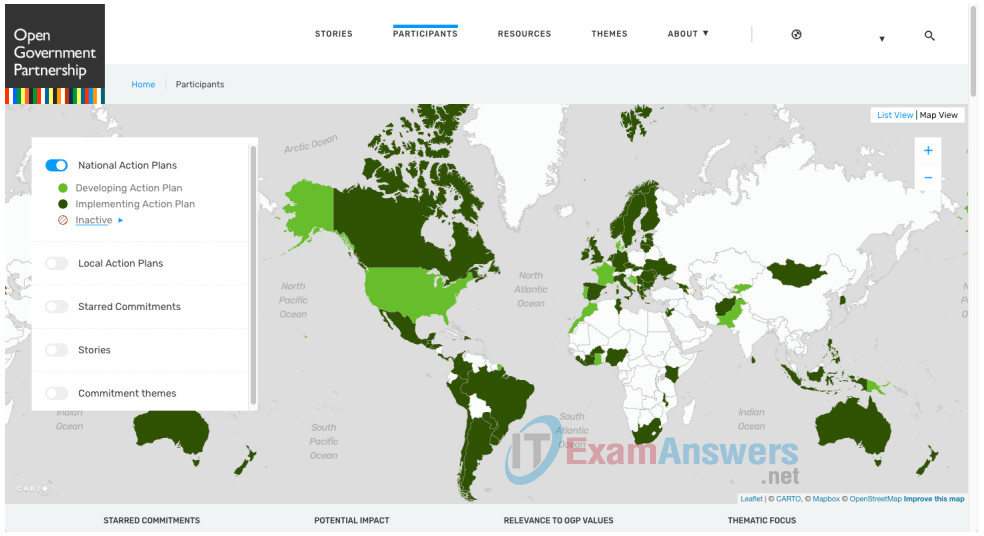
List several countries that participate in the OGP.
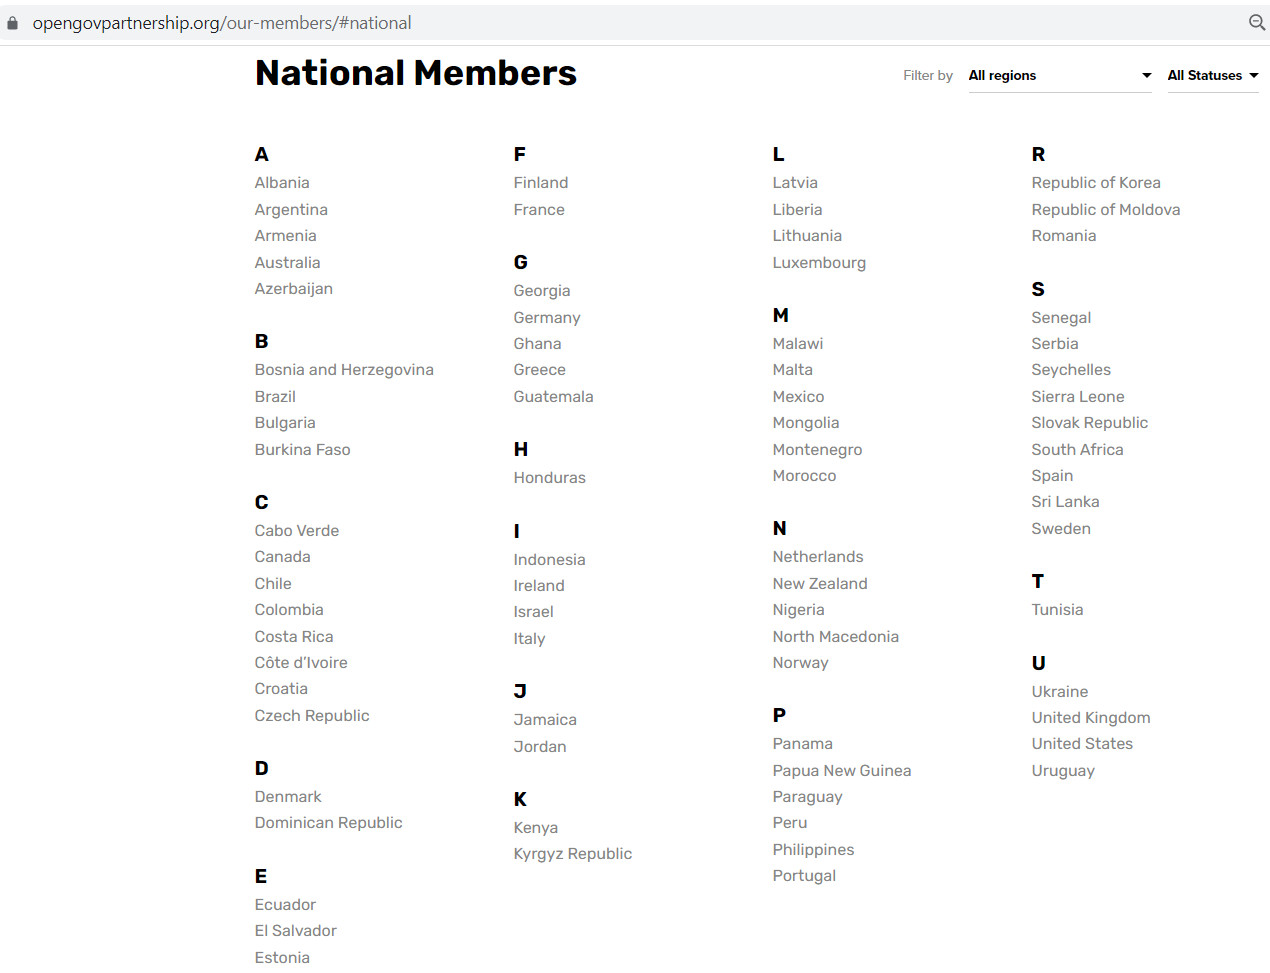
c. Select a country using the map or the list at the bottom of the page to view information about that country’s participation in open data. Using Albania as an example, a page displays an overview of the country’s journey to join OGP. There are also many links to information regarding the country’s move toward a more open government.
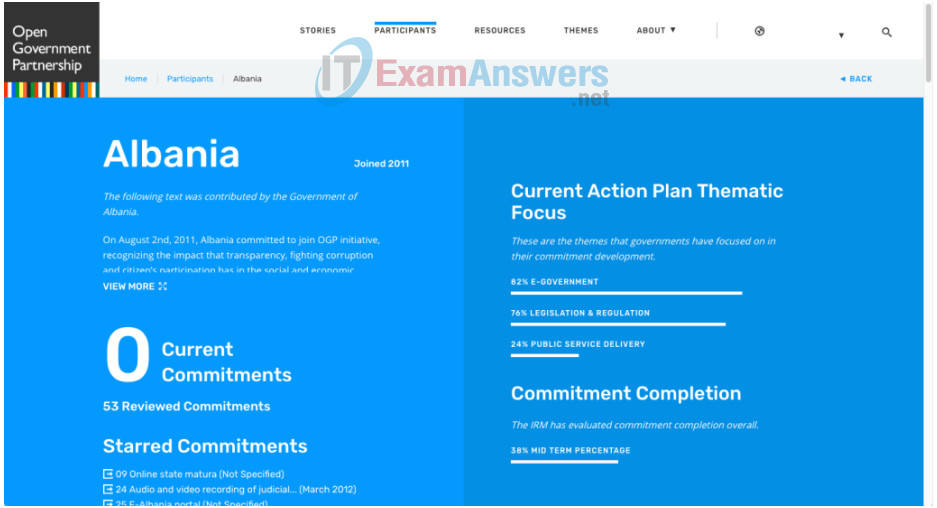
d. The top of the page includes an overview of this country’s participation in the OGP. Scroll down the page to see additional information including Action Plans and Reports. Click People involved from Albania (or your selected country) to see a list of the people who are involved from this country.
e. Click Resources at the top of the screen. This page allows you to see information relevant to who you are and what your interest is.
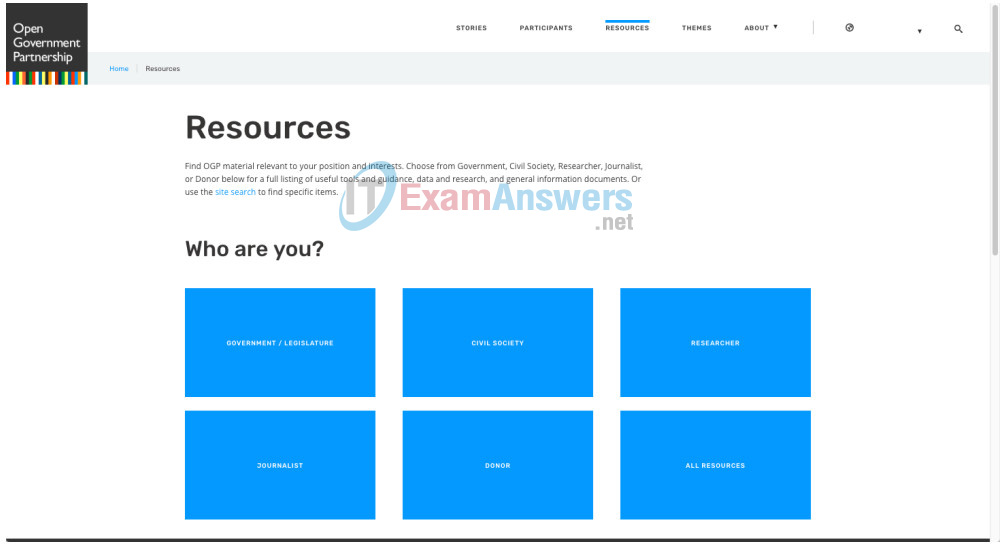
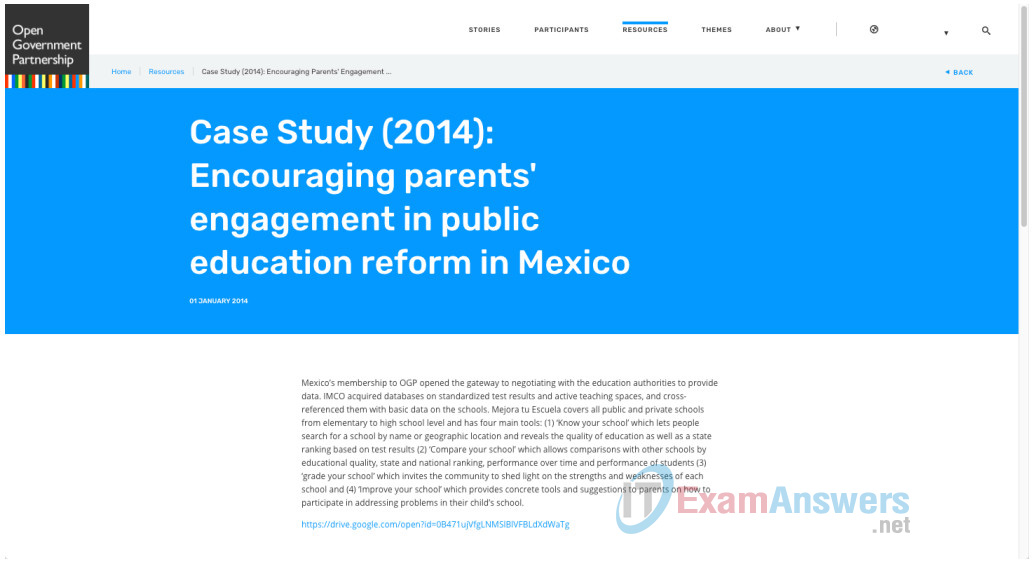
f. Select All Resources (blue box). On the All Resources page, select Data and Research (below the All Resources heading). You will receive a variety of information. Select one of the case studies, for example Case Study (2014): Encouraging Parents’ engagement in Public Education Reform in Mexico.
g. Read the overview of the case study and then click the link below to see additional information.
How can you as a citizen benefit from a more open government?
The open government increase
Part 2: Open Data Websites
Many organizations, such as governments, universities, businesses, and non-profit organizations publish their open data. Are you interested in data about weather, housing, or crime?
a. Navigate to http://www.data.gov. This website is the home of the U.S. Government’s open data. At this website, you can find data and resources about research, software development, and other projects related to data. From this website, you can also navigate to the original websites that provided the published information.
b. Click Data at the top of the screen.
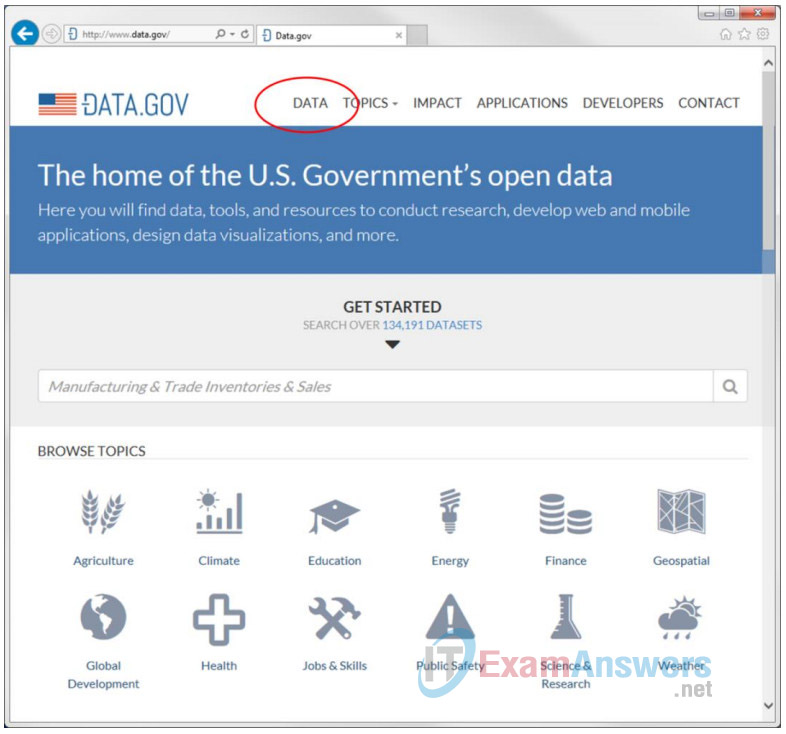
c. How many datasets are available? 249,275
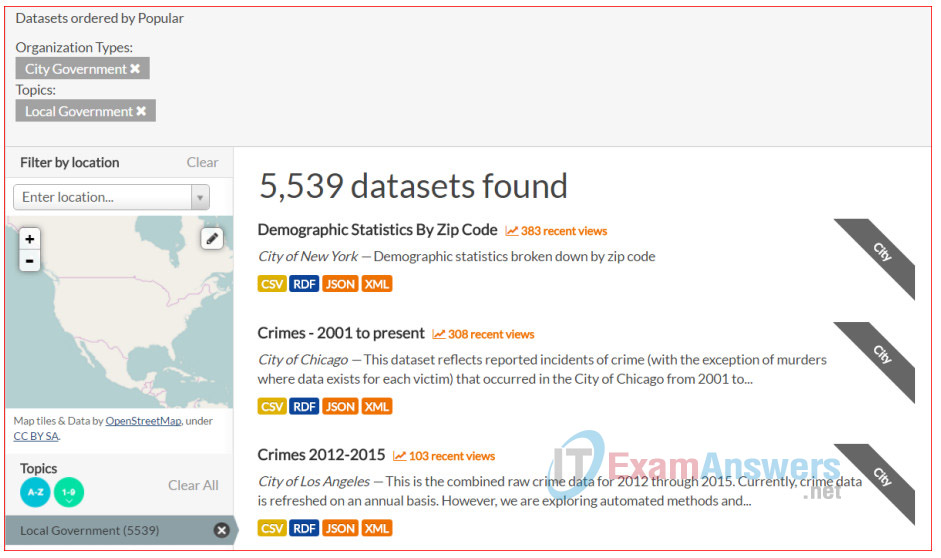
d. Explore an interesting dataset or different topic category. For example, you can filter by different categories. If you are only interested in the data provided by a city government, click Data at the top of the screen. Click Local Government. Scroll down the list until you locate Organizational Types on the left panel. Click City Government.
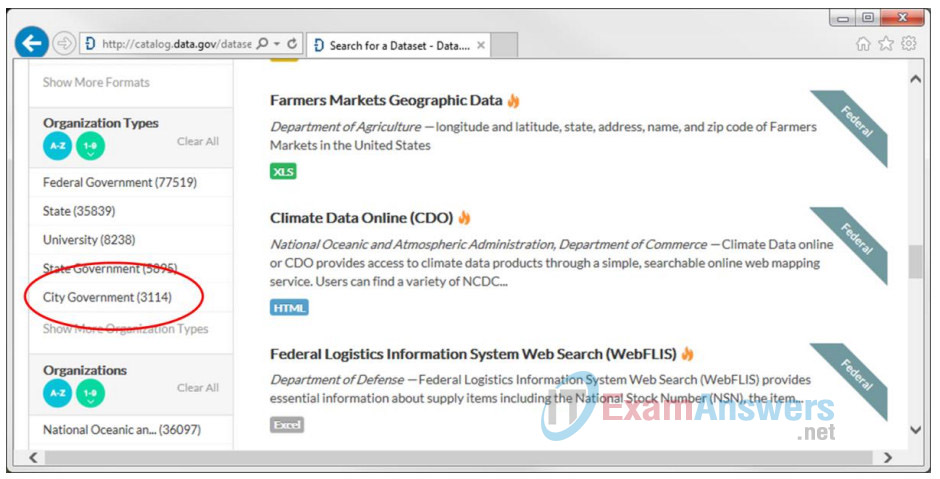
e. Click Crimes – 2001 to present. This dataset provides the crime statistics for the City of Chicago from 2001 to the present.
f. You can download this dataset by scrolling down to the Downloads and Resources section.
What are the available downloadable file formats?
CSV RDF JSON and XML File.
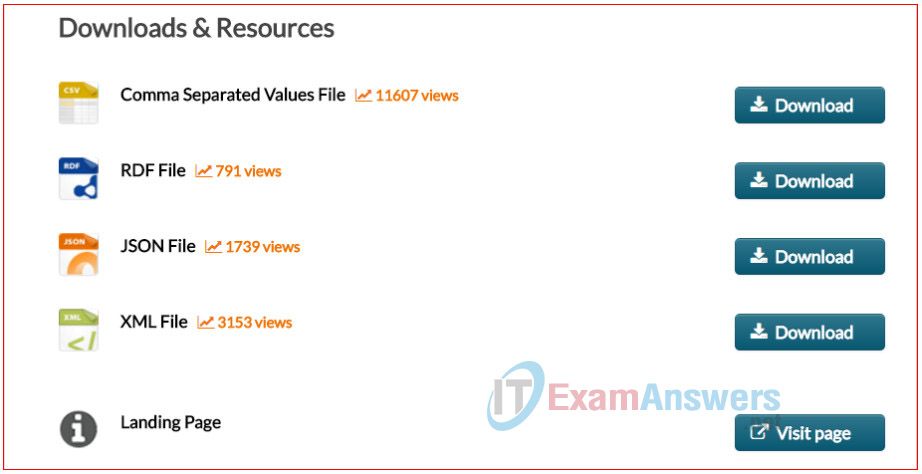
Click the Landing Page link under Downloads and Resources section to navigate to the City of Chicago’s Data Portal for the Crimes – 2001 to present page.

g. On this page, you can view the crime data for the City of Chicago from 2001 to the present without downloading the data. You can also view a portion of this data on a map. Click City of Chicago at the top of the page to navigate to the list of datasets available from the City of Chicago Data Portal. Under View Types, click Maps.
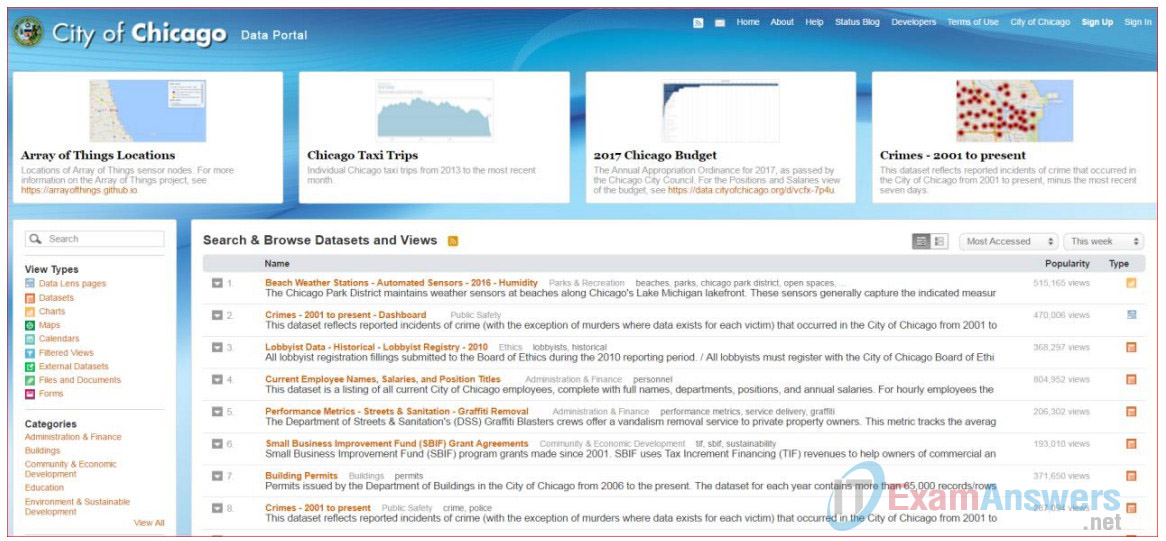
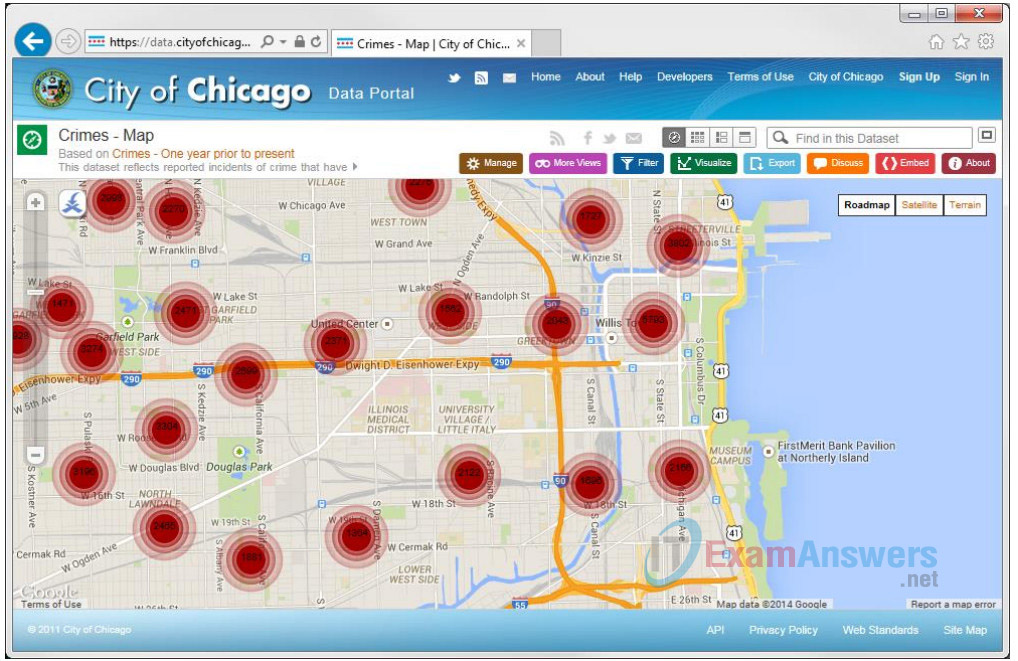
h. Under View Types in the left panel, click Maps to display a list of maps. Click the dataset titled Crimes – Map. This presents an interactive map of the Chicago area with crime locations for the past year.
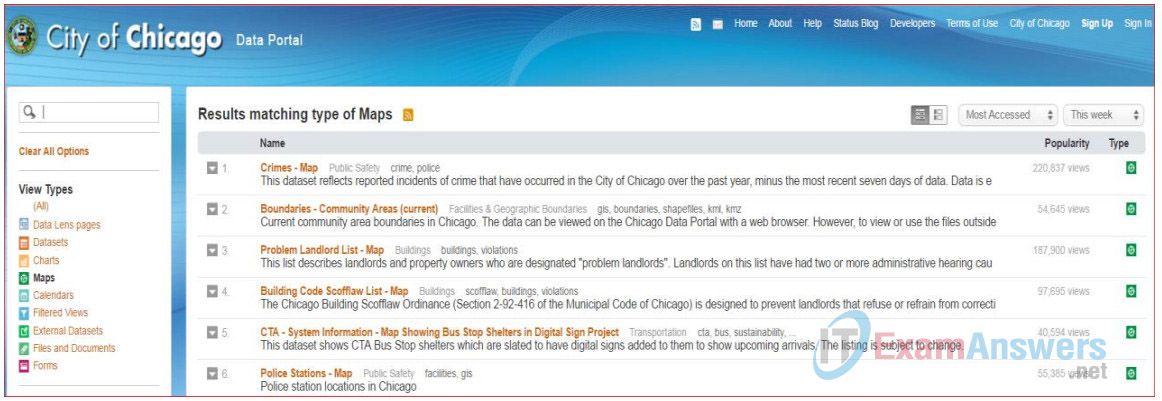
i. Click dataset titled Crimes – Map. This presents an interactive map of the Chicago area with crime locations for the past year. You can explore the crime locations by clicking the red dots or zooming in using the scroll bar on the left.
j. If you are interested in other organizational data, you can navigate back to http://www.data.gov and search for other topics. Similar websites for other countries can be found by searching on the Internet. For example:
Australia: http://data.gov.au/
U.K.: http://data.gov.uk
Canada: http://data.gc.ca
Part 3: Data Visualization
Data visualization can help you make sense of lists of numbers and present the lists of numbers in a meaningful way. Visualization can help you “see” trends that may be otherwise missed.
There are websites that provide data visualization for you. You will explore data visualization using the graphics provided on these two websites: www.knoema.com and www.gapminder.org.
Step 1: Explore knoema
At www.knoema.com, you can find many ways to graphically represent statistical data.
a. At the home page, scroll down. A list of different topics displays, such as This Just In, and Viz of the day. Scroll down the page to view many more topics that you can explore.
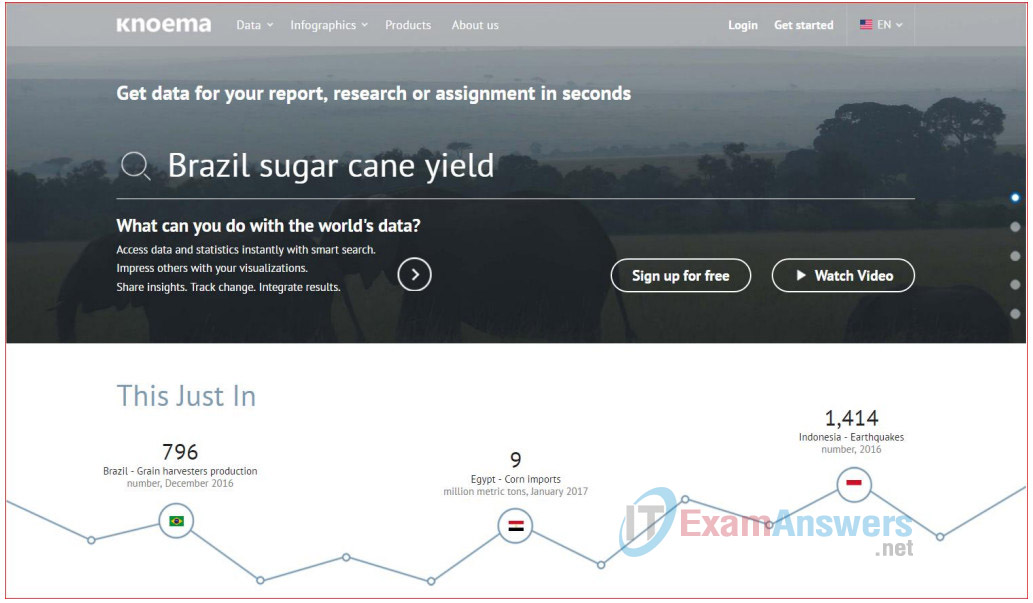
b. What is the topic for Viz of the day?
Evidence for Chinese Economic Recession
c. Click the title and explore the issues and the different graphs available to you. Name the data sources.
Knoema, China Fact Deck
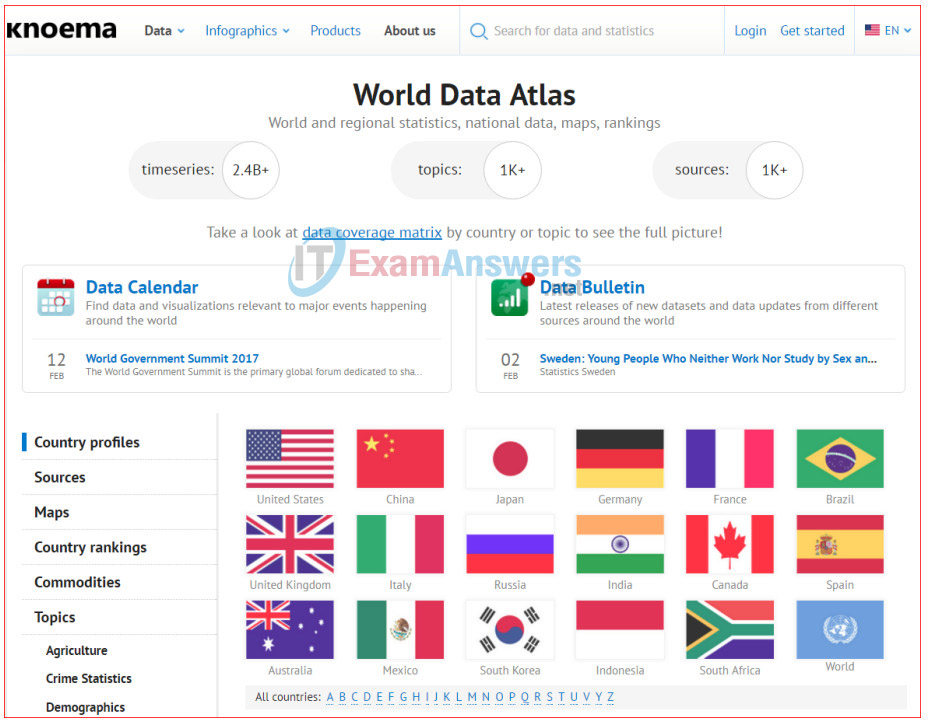
d. At the top of the page, click the down arrow next to Data. Click World Data Atlas. From here, or from any category, you can explore the variety of data available to you.
Step 2: Explore Gapminder
The mission of the Gapminder Foundation is to fight knowledge gap using statistical data gathered from various sources. By creating rich data visualization and animated data presentations, statistical data becomes interesting.
In this step, you will explore the free material available from www.gapminder.org.
a. Navigate to www.gapminder.org.
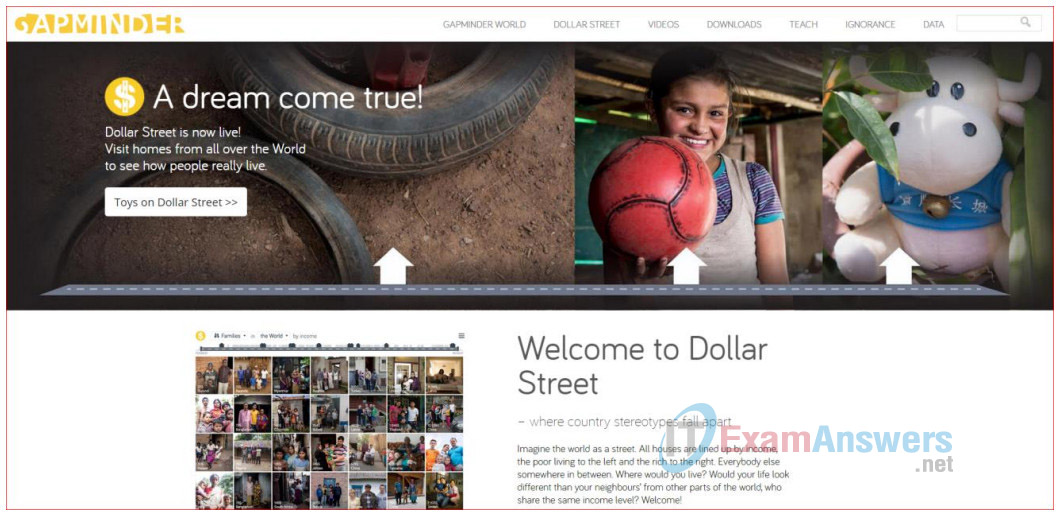
b. Click Videos to view presentations that bring statistical data to life and make the data more relevant to you.
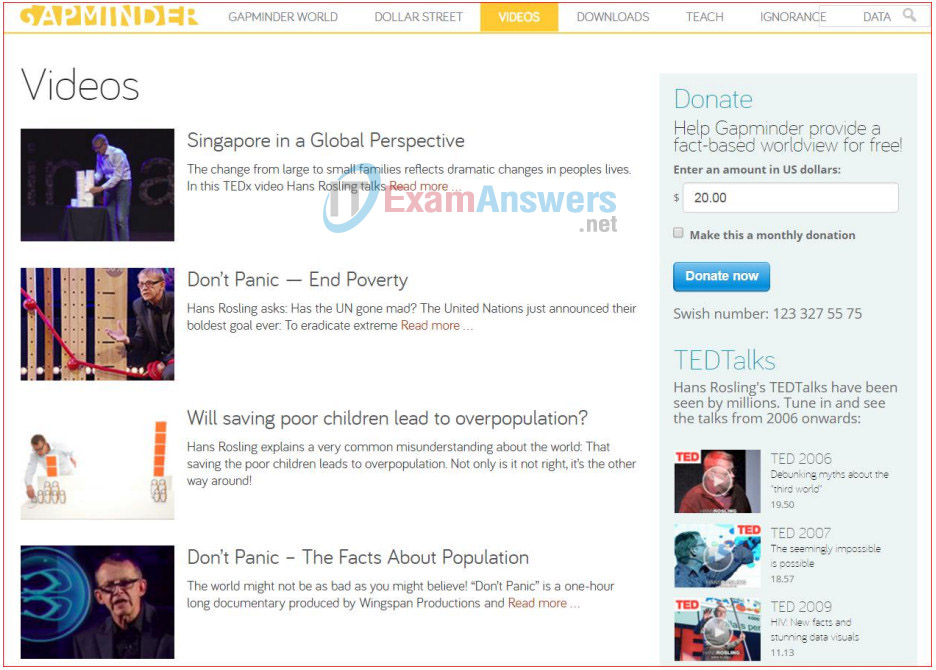
Find videos that are of interest to you. After viewing some of the videos, how did it change your perception of the world?
First Video Name “Using photos as data to understand how people live” and ittalking about how photo can give us data by compare different lifestyle fromdifferent country and improved the people how live in same country don’t havesame lifestyle and the main thing to measure standard of living its money wouldyou have and this theory named “Dollar street”Second video Name ” Religions and babies “and it talking about if there’srelition between religion and babies the presenter show interactive map forreligion and found on 1960 most of rich country except araba gulf countryhave 2or 3 child as average from Christian country and in 2010 almost all country in theworls have 2 or 3 child. In Libya in 1969 we was have great GDP best than USAand Kuwait with 7 to 8 baby to per women in 2018 we have bad GDP rate with 2.2baby to woman.This website of interactive map and I recommended it: https://www.bit.ly/K8QAde.
c. To interact with the bubble charts that were presented in the videos, click Gapminder World.
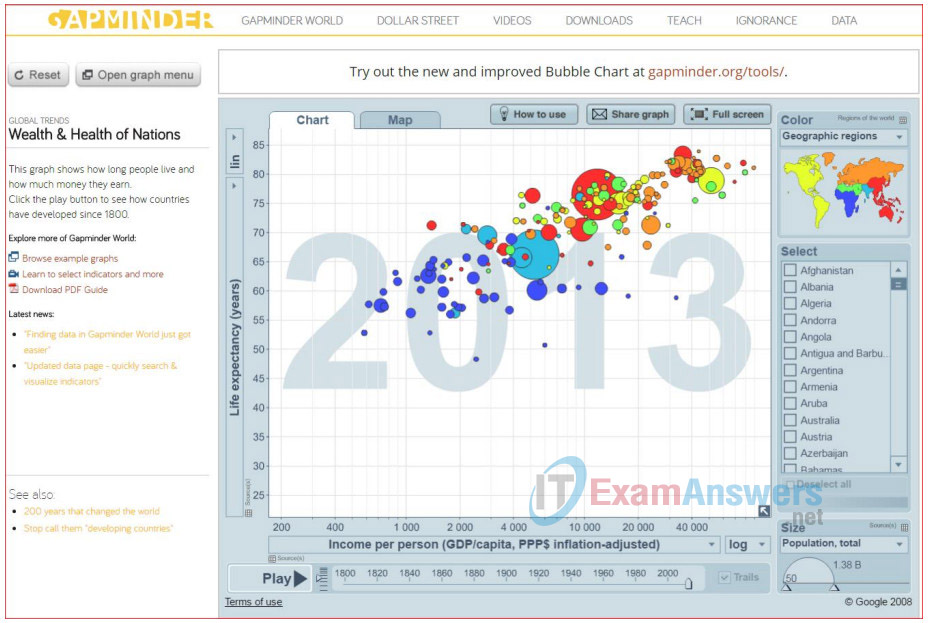
d. Click Play. Observe the scatterplot changes for the trend between Life expectancy (years) vs. Income per person. Each of these bubbles represents the progress of a country.
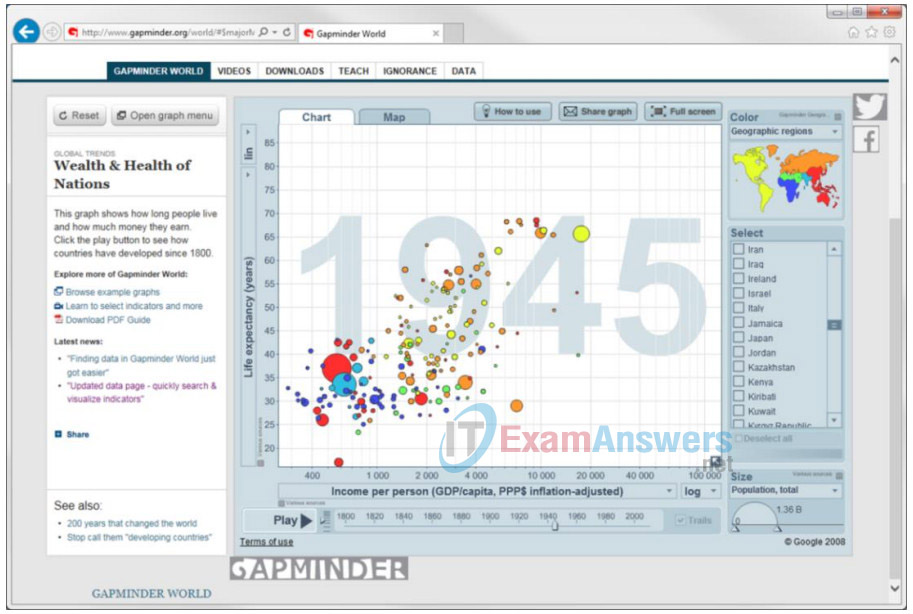
What relationship did you observe?
I release these strong relation between life expectancy and income person so as example in Qatawith 128 k person income year and USA with 54k we release the life expectancy it’s 80 or aboveand in country with less income as Libya with 18k you can see the life expectance reduce to 75but when we move to poor country as central Africa we can see the life expectance reduce to 51year with 689 dollar income on the year.
e. Change the y-axis Life Expectancy (years) to Population aged 60+ years, both sexes (%) so the chart compares the percentage of the population over 60 with income per person.
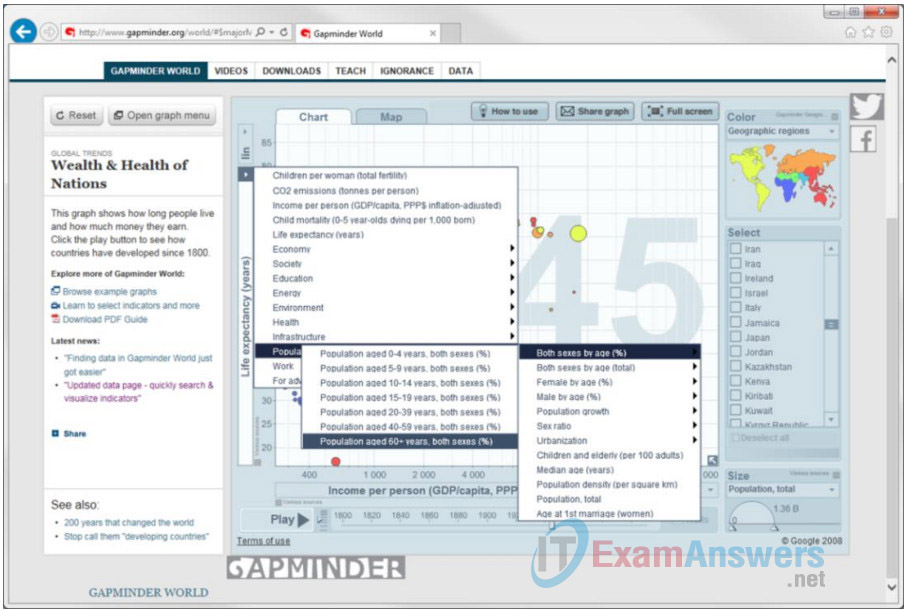
f. Now select a few countries to highlight their path from 1950 to 2012. In this example, Canada, Germany, and Japan were selected. Japan will have the highest percentage of their population at 60+ years of age in 2030 according to the data visualization from http://knoema.com/awppbnd/how-well-ageing-populationis-faring.
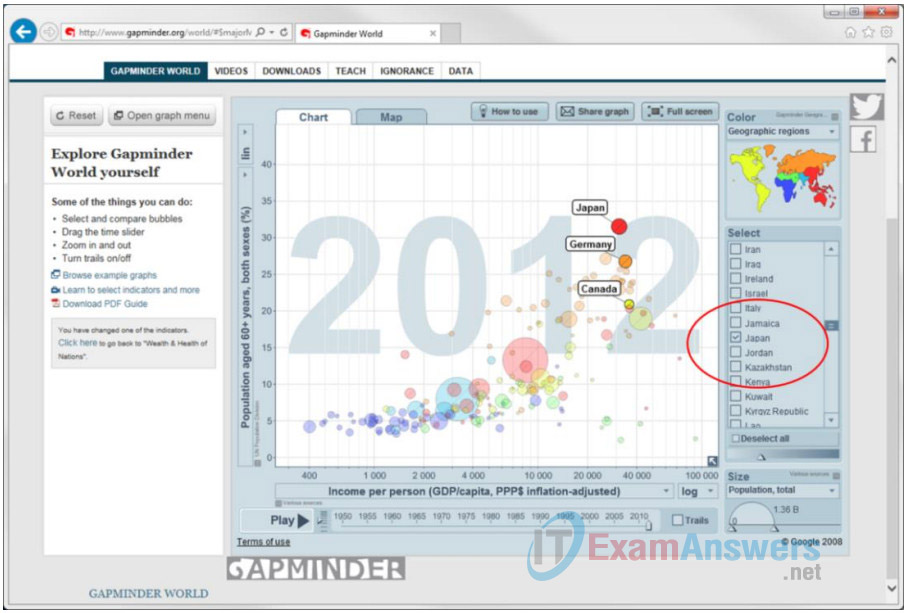
g. Click Play to observe the trace for these three countries.
What relationship do you see?
In 1970 Libya and Tunisia have same range about 5% all population and USA has 12.55 from allpopulation but Libya stay in same rang almost because in 2017 Tunisia increase about 8% to 12.7%
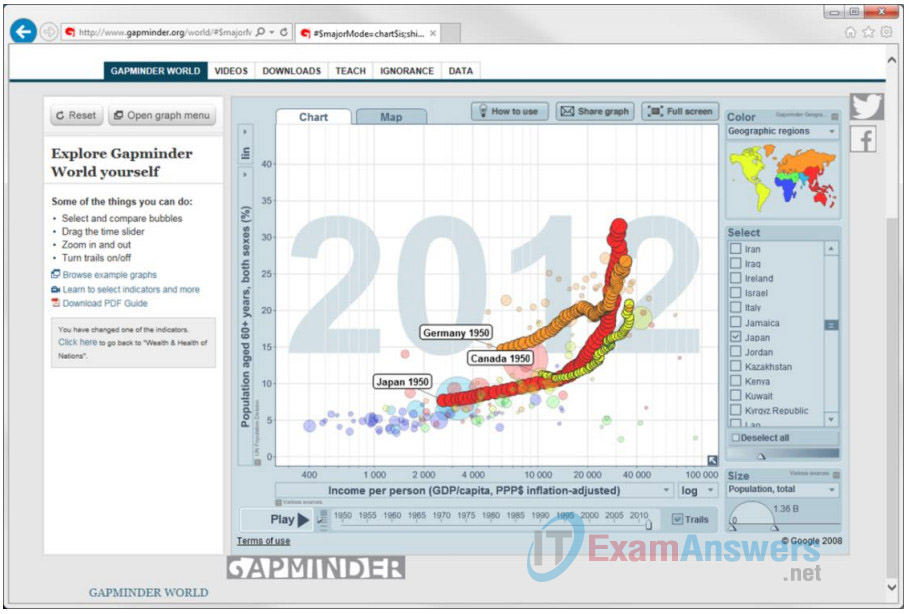
And USA to 10% to increase to 22% but Libya increase just 1.8 to reach 6.8%. so I can release themost important things to control of rate increase its 1-religon of country because the country howimplement religion Islamic roles has low percentage of 60+ as UAE USA Kuwait Libya Yemen..Etc.2-almost all modern country like Japan USA French Italy have high number of 60+ percentage andthis return to good Financial status and number of publication on those country.
h. The data sources used in these charts are available to you by clicking the grid symbol next to the x or y axis on the chart. Click the grid symbol to view or download the raw data.
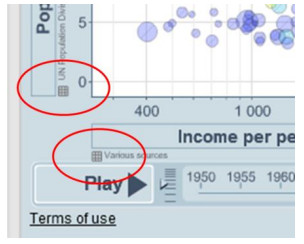
Source: Free material from www.gapminder.org
Reflection
Now you have had a brief introduction to data visualization from different websites. Choose your favorite data visualization website and perform a visualization of your own.
Briefly describe the visualization you performed.
Gapminder website is best visualization web site, my visualization of my it number of child death inLibya and Finland because have same population. in 1955 Libya have 23K child data on year but inFinland it was 2640 so its big different between two country but when Oil explored in Libya thisnumber reduce to rich in 2000 to only 3310 but in Finland the number reduce to 222 child only Now in 2015 Libya has 1680 child death in yearagents only 135 in Finland. Its big different for Libya butthere’s space to reduce the number of child and reach to Finland rate on some day.
What did you learn as a result of the visualization?
The visualization tis describe how the Data important to make the world better by analysis past andpresent data to avoid mistakes and solve problem.
