2.1.1.8 Lab – Create a Process Flowchart Answers
Objectives
- Part 1: Recognize Symbols Used in a Flowchart and List Logical Process to Solve a Problem
- Part 2: Draw the Flowchart to Illustrate the Problem Solving Process
Background
Flowcharts are diagrams used to represent processes or workflows. Using different shapes, boxes, and connecting arrows, a flowchart represents the solution flow to a given problem. Flowcharts are commonly used to represent programs, algorithms, or any ordered process in various disciplines. Flowcharts are typically created prior to starting a process or writing an application in order to verify and catch potential logic flows toward the solution before it is developed and implemented.
Flowcharts can be hand drawn or created using a number of packages including Microsoft Office products, LibreOffice, GoogleDocs, and various web applications such as https://www.draw.io/.
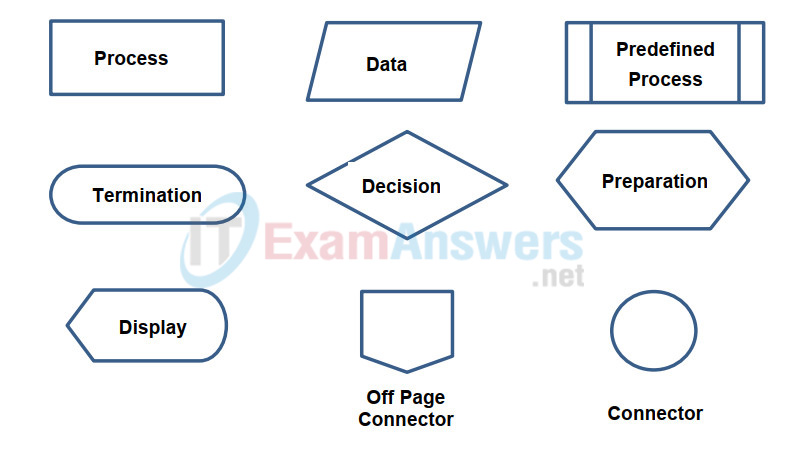
Some of the most common flowchart symbols that used for programming are shown in the diagram along with their intended purpose for the symbol. Lines with arrows indicate the flow of the problem solving process.
Scenario
You are required to develop a systematic process to find a predetermined number. The process developed is represented in a flowchart. Using the flowchart, we can check and verify the logical process toward the problem.
Required Resources
- This lab can be done with paper and pencil or a PC with internet access (or office productivity applications, such as Microsoft Office, LibreOffice, and GoogleDocs.
Instructions
Part 1: List the logical steps required to solve a problem
The problem is to develop a process to find a predetermined number. The process can be programmed as a simple computer game. A player is asked to think about an integer number between 0 and 128, The program will use the bisection method to find the number.
Step 1: List the steps needed to solve the problem.
a. Ask the player to think about an integer number between 0 and 128.
b. Set a as the lower end, b as the high end, and t as the time of calculation
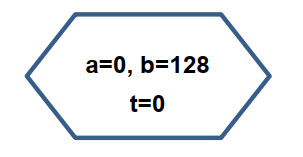
c. Set initial values, a = 0, b = 128, t = 0
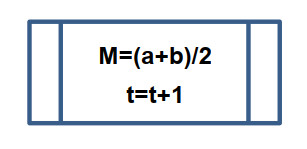
d. Calculate the average number between a and b. Set it as M.
e. Set t = t + 1
f. Ask the player if M is the correct number:
If yes, print “The number you thought of is M and I guessed it t tries.” End the process.
Else
If t = 6
If yes, print “I am sorry that I cannot guess it after 6 attempts.” End the process.
Else
Ask the player if M is larger than the correct number:
If yes, set a = M, jump to Step d.
Else
Set b = M, jump to Step d.
Questions:
Can the process catch if the number the player has chosen is 0 or 128? Why or why not?
Since the method used is bisection, the trial number is an average of the lower and upper bounds. The average number is set to integer. Therefore, the process cannot tell whether it is 0 or 128.
If 0 or 128 cannot be caught, what should be done to correct it?
Answers may vary. From the problem itself, we can prevent a player from choosing 0 or 128. For example, specify “Think of a number between 1 and 127 inclusive.” However, a better solution is to modify the process so that it checks to see if 0 or 128 is the correct number before the calculation begins.
Part 2: Draw the Flowchart
Step 1: Use appropriate flowchart symbols for each functions.
Because the list of process steps is identified, we can use flowchart symbols to represent each step.
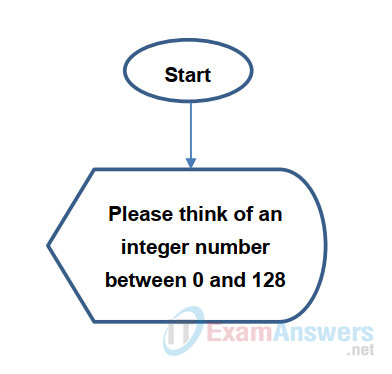
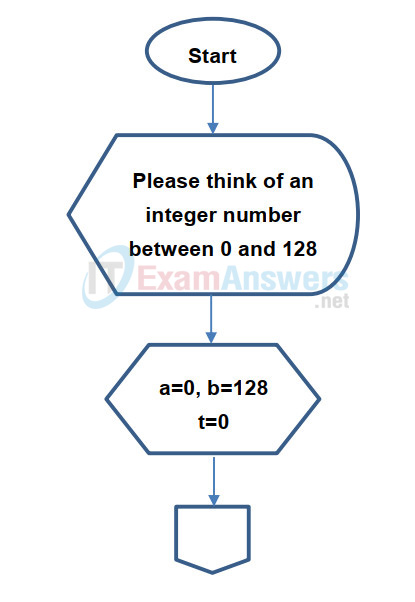
a. Use an oval symbol as Start and a Display symbol to ask questions. Use a line to link them:
b. Use a preparation symbol to make initial assignment:
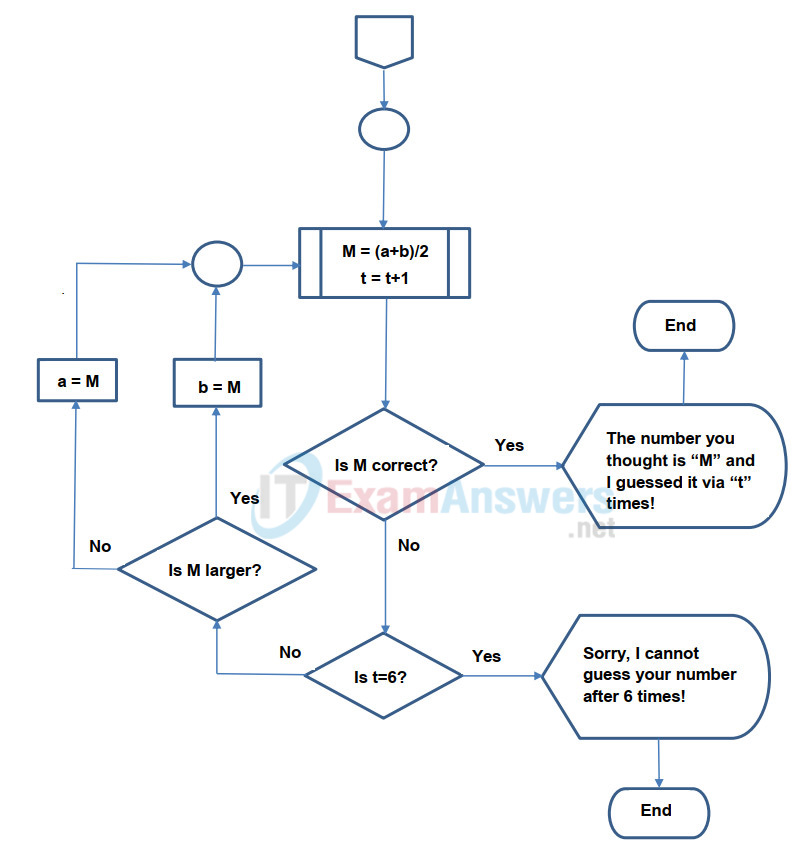
c. Use a predefined process symbol to define a process function or routine:
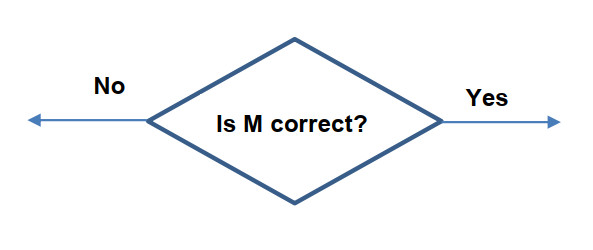
d. Use a decision symbol to represent a condition test:
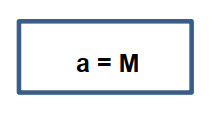
e. Use a process symbol to represent an operation:
Step 2: Draw the complete flowchart.
Now we can use symbols to draw a complete flowchart. We will use the Off Page Connector and Connector to extend the flowchart to next page:
Reflection
What is the significance of testing if t=6?
128 is 27. With the bisection method, the maximum number needed to find a number in the range 1 to 127 is 6.
Where should the test for the numbers 0 and 128 be placed?
To reduce unnecessary processing, these two tests should be performed as soon as we receive the player input, eg before initial values for parameters are assigned.

Very randomized answers :(