1.1.3.11 Lab – Draw a Process Diagram (Instructor Version)
Objective
In this activity, you will draw a process diagram based on open-loop and closed-loop processes. Explore tools to produce your own process diagrams.
Background/Scenario
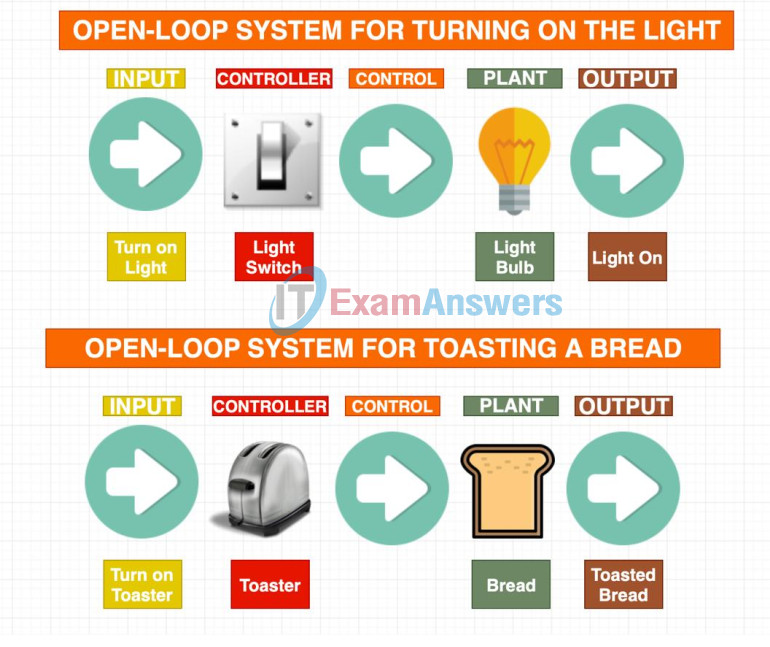
Open-loop and closed-loop control systems are two basic types of control systems. In an open-loop system, a controller instructs the plant to perform a predetermined action without any verification of the desired results. A closed-loop control system continuously monitors the performance and adjusts the input as necessary to ensure the desired result is achieved.
A process diagram can help you identify and understand the components of a control system. In this activity, you will complete process diagrams for common activities. You will also explore some available tools to produce your own process diagrams.
Part 1: Process Diagram for Open-Loop Control Systems
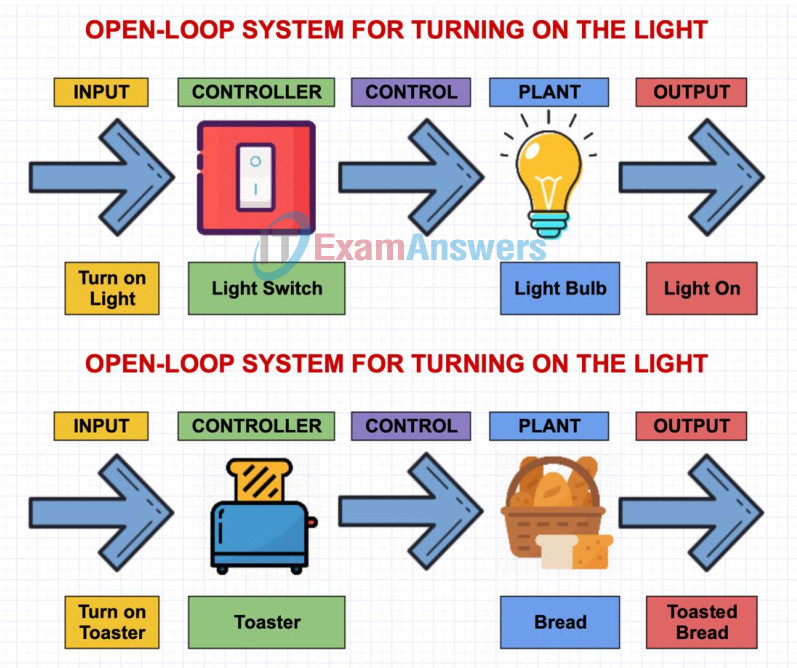
An open-loop control system can process an input condition to produce an output. Fill in the controller and the plant for each process shown below.
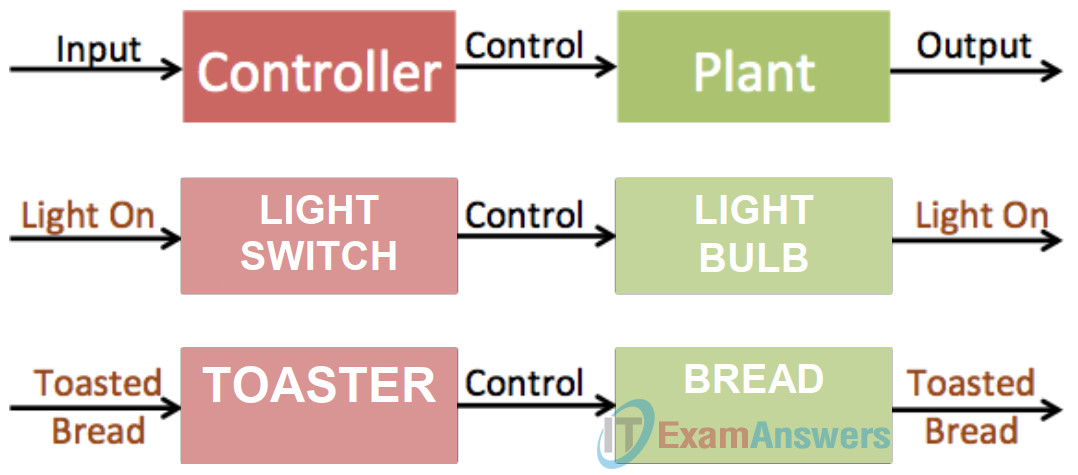
What can be added in the process diagrams to verify the desired output has been achieved?
One thing that can be added in the process diagram to verify that the desired output has been achieved is that we can add sensors to make sure that the desired output has been achieved. Another thing is that it can make it as a closed-loop system.
Part 2: Process Diagram for Closed-Loop Control Systems
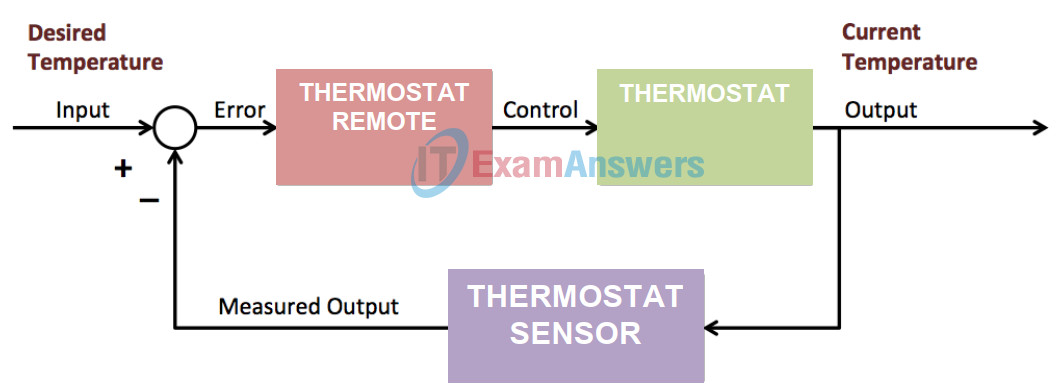
In a closed-loop control system, the output is monitored to ensure that the desired results are achieved when the process is finished. The sensor in the process diagram provides the feedback information so adjustments can be made during the process. Fill in the controller, plant, and sensor for each process shown below.

Room Temperature
Water Sprinkler System
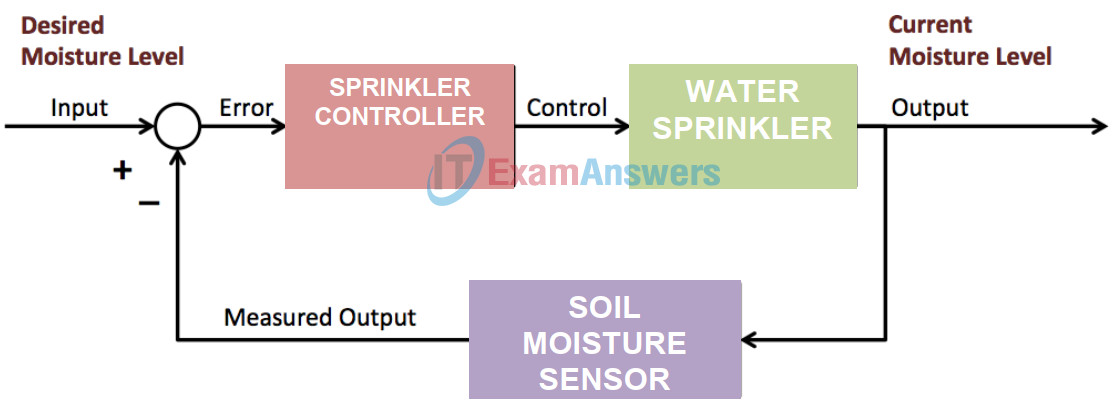
What other external conditions could affect the system? How would you account for these external variables?
External variables are factors outside the scope of the experiment, such as a participant becoming sick and unable to attend. Other outside conditions could incorporate creatures or other individuals. You can take prudent steps by setting up signs or a barricade(for creatures) to keep them from meddling with the framework.
List several smart products available to control indoor temperature and use water efficiently?
Some of the products available to control indoor temperature and use water efficiently are the following: HVAC, Nest Thermostat, Hydrawise, Honeywell, Blossom, Skydrop, ZEN Thermostat, Rachio 3 smart sprinkler controller, Dual Fuel – Hybrid Heat, Geothermal Heat Pump, Chilled water cooling, Ultra Efficient Boilers, Solar Assist Hot Water and many more.
Part 3: Diagram Software
There are many free diagram programs available on the Internet. Draw IO (https://www.draw.io) and Gliffy (https://www.gliffy.com) are just two examples of the online diagram software.
Step 1: Draw IO
a. Navigate to www.draw.io.
b. Choose the location to which to save the diagrams.
c. Choose to create a new diagram or open an existing diagram. Depending on the location, you will authorize access to the cloud services.
d. If you are creating a new file, provide a new filename. Click Create to continue.
e. Explore the different types of icons available.
f. Create a diagram based on the diagrams used in this activity.
Step 2: Gliffy
a. Navigate to www.gliffy.com.
b. Click Start Drawing to begin creating diagrams.
c. A dialog box with tips appears. You can view the tips, and click Start Drawing to continue.
d. Provide the necessary information to sign up for a free trial account to continue.
e. Explore the different types of icons available.
f. Create a diagram based on the diagrams used in this activity.
Step 3: Compare
Now that you have used both programs, which program would you prefer for collaboration? Explain.
Draw.io has numerous highlights that Gliffy essentially doesn’t bolster by any means, which make making graphs simpler. Here are only two activities that draw.io gives you a chance to do that aren’t bolstered by Gliffy: Drop another shape onto a connector to embed it between two different shapes and consequently associate it to both existing shapes. Just drag the .vsdx document into the draw.io attracting region and all pages your chart will be brought into their own page. With draw.io you need to move the mouse and snap significantly less than in Gliffy to accomplish something very similar.
Simply take a gander at our video to perceive how a lot of time you spare in any event, while making a basic two-component graph
DRAW.IO:
GLIFFY:
