6.3.1.9 Lab – Create a Sequence Diagram for Your Project (Answers)
Topology

Objectives
- Use WebSequenceDiagrams to Describe a Process
- Save, export, print, and share the diagram
Background / Scenario
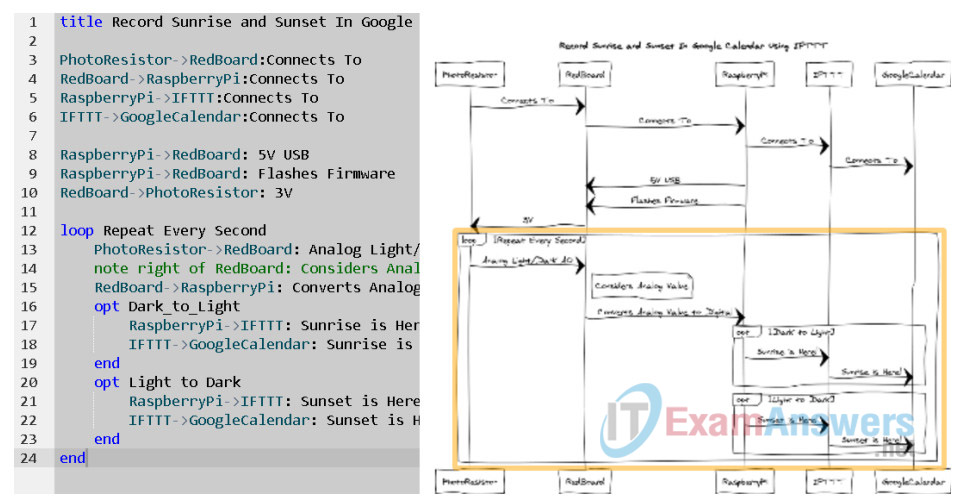
WebSequenceDiagrams is a website which allows users to diagram interactions between objects. In this lab, you will create a sequence diagram describing the process of using a RedBoard and Raspberry PI to record sunrise and sunset events using IFTTT on Google Calendar.
Required Resources
- PC with Internet Access
- Ethernet based connection to the Internet with DHCP and no traffic filtering
Part 1: Use WebSequenceDiagrams to Describe a Process
Step 1: Register a free user account at WebSequenceDiagrams
If you currently do not have a WebSequenceDiagrams user account, go to https://www.websequencediagrams.com/ to register for free.
Step 2: Title the diagram
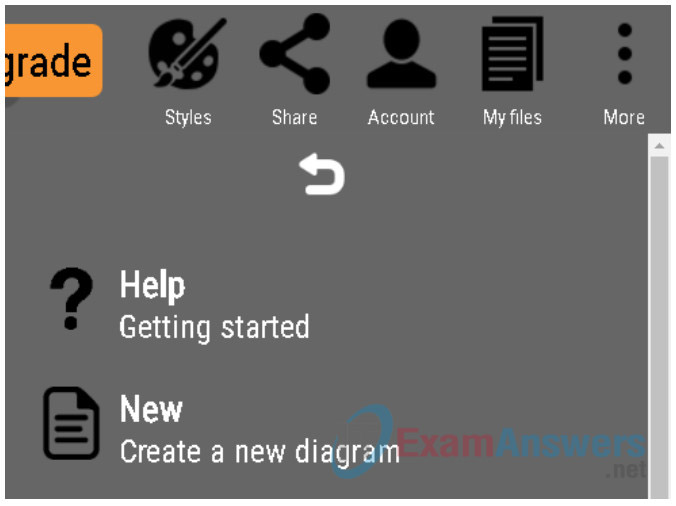
a. Using the More menu in the upper right corner, click New to start a new diagram.
b. Name the project by using the keyword title in the first line of the text area in the new diagram.
title Record Sunrise and Sunset In Google Calendar Using IFTTT
Step 3: Organize the objects into the diagram
a. Place objects needed to record the sunrise and sunset into the diagram by entering the text lines below. Objects are created by interpreting various special characters in the text. For instance the ‘->’ sequence creates a relationship between two objects and the ‘:’ provides a description of the relationship.
PhotoResistor->RedBoard:Connects To
RedBoard->RaspberryPi:Connects To
RaspberryPi->IFTTT:Connects To
IFTTT->GoogleCalendar:Connects To
Note: The object names are case sensitive.
b. Slide the grey area to make the diagram larger or smaller.
c. Click various arrows in the diagram to highlight the associated code.
d. Add additional descriptions for the connections between the physical objects in the diagram.
RaspberryPi->RedBoard: 5V USB
RaspberryPi->RedBoard: Flashes Firmware
RedBoard->PhotoResistor: 3V
Step 4: Record events in a loop
a. Create a loop diagram describing the process of sampling the photoresistor every second using the loop keyword.
loop Repeat Every Second
PhotoResistor->RedBoard: Analog Light/Dark A0
note right of RedBoard: Considers Analog Value
RedBoard->RaspberryPi: Converts Analog Value to Digital
end
b. Move the cursor above the end statement to place more code inside of the loop.
c. Add the actions that the Raspberry Pi and IFTTT would take if the photosensor changed from dark to light, or vice-versa.
opt Dark_to_Light
    RaspberryPi->IFTTT: Sunrise is Here!
    IFTTT->GoogleCalendar: Sunrise is Here!
end
opt Light to Dark
    RaspberryPi->IFTTT: Sunset is Here!
    IFTTT->GoogleCalendar: Sunset is Here!
end
Note: Correct spacing is required for the diagram to render properly
d. Examine the competed diagram
Part 2: Save, export, print, and share the diagram
Step 1: Save the diagram
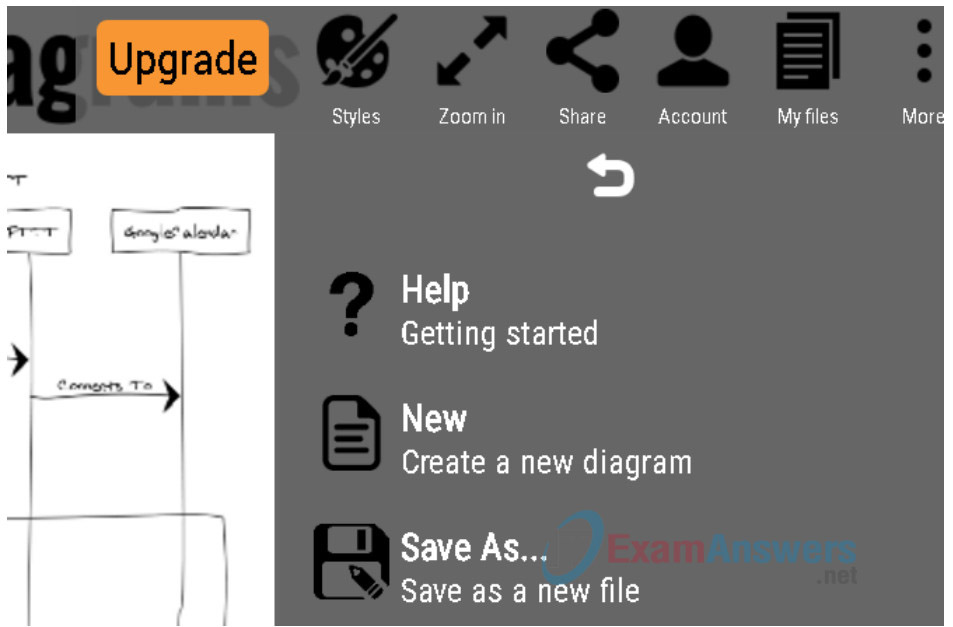
a. Using the More menu in the upper right corner, click Save As to save the diagram.
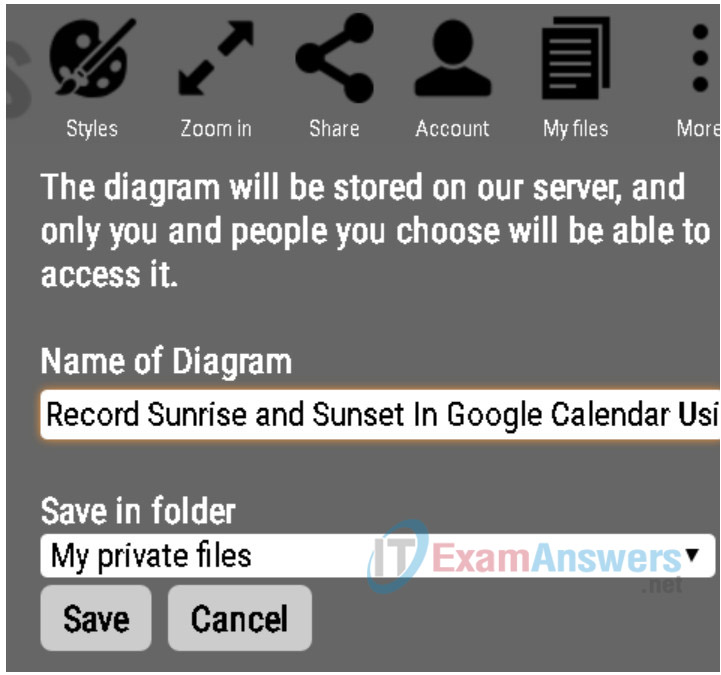
b. Name the diagram appropriately and click Save.
Step 2: Save an image of the diagram
Using the More menu, click Export to render the diagram as an image.
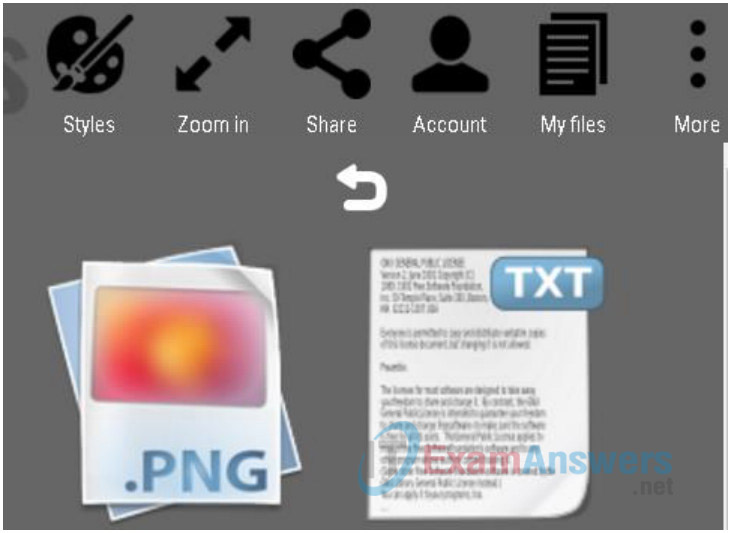
Note: Only the .png image is available using the free service.
Step 3: Print the diagram
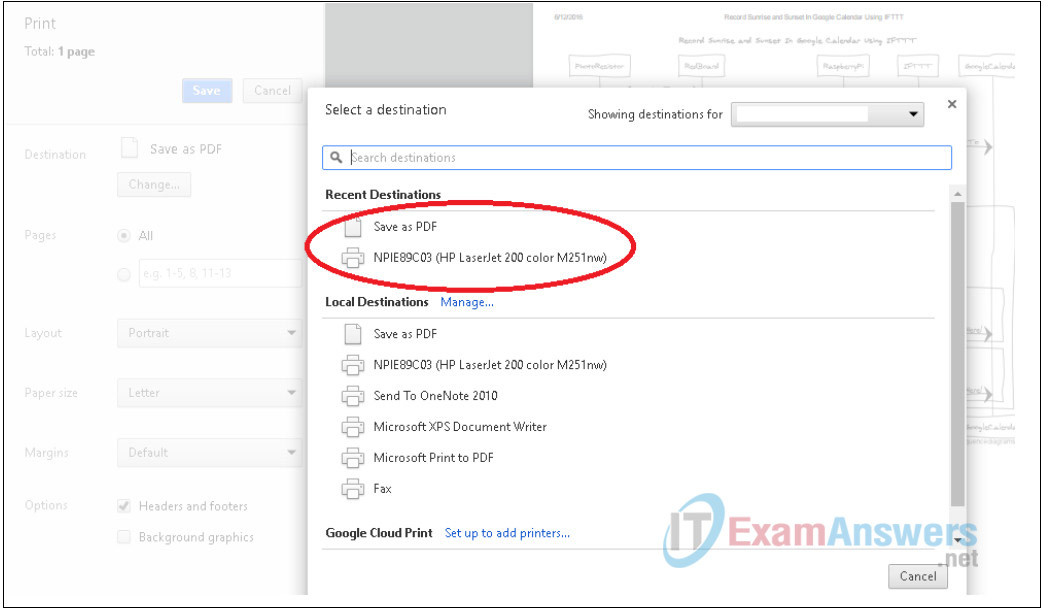
Using the More menu, click Print to direct the diagram to the printer or save it as a PDF.
Step 4: Share the diagram
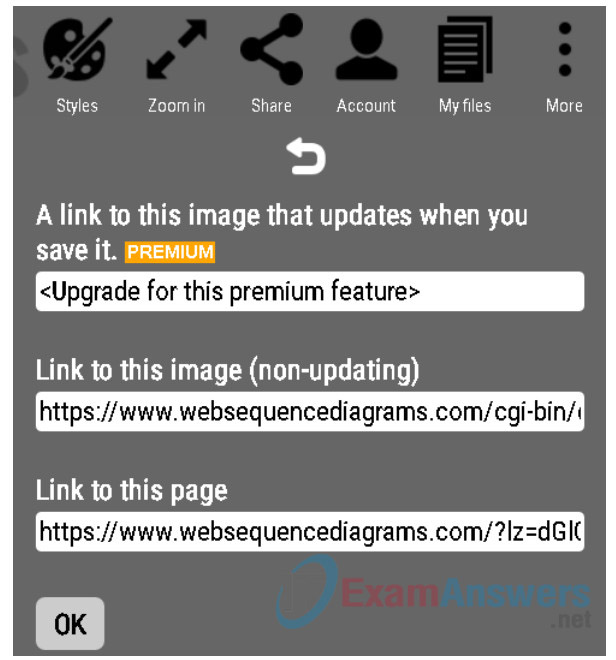
Click the Share button to create a static link to the diagram.
Reflection
What is the purpose of diagraming IoT interactions?
Most people understand diagrams more easily than electronics and codes. Creating a diagram can also help people spot flaws in logic.
