3.2.6.5 Lab – LED Line and Graphs Using PL-App (Instructor Version)
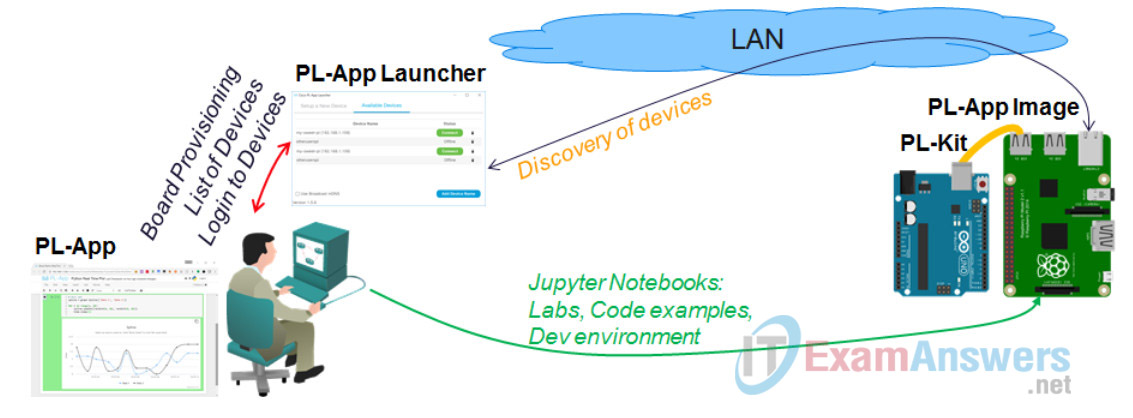
Topology
Objectives
Part 1: Building the Electronic Circuits
- Connect five LEDs to the Raspberry Pi to form a line
- Add a potentiometer to a RedBoard
- Connect the RedBoard to the Raspberry Pi
Part 2: Use the PL-App with the Raspberry Pi and RedBoard
- Connect the Raspberry Pi to PL-App
- Create a new Visual Programming application
- Create an application to read out analog values using RedBoard
Part 3: Visualize the Data in a Line Chart
- Create a Line Chart
- Modify the code to send a signal to PL-App
Background / Scenario
In this lab, you will connect a RedBoard to a Raspberry Pi and learn how to control it from the Raspberry Pi via the PL-App interface. You will also learn how to represent the currently measured values from analog sensors on a line of LEDs and how to draw charts in the PL-App interface.
Required Resources
- PC with Internet Access
- Ethernet based connection to the Internet with DHCP and no traffic filtering
- Raspberry Pi that is configured and imaged for PL-App access
- RedBoard or compatible
- Breadboard, resistors, LEDs, wires
Part 1: Building the Electronic Circuits
Step 1: Connect five LEDs to the Raspberry Pi to form a line
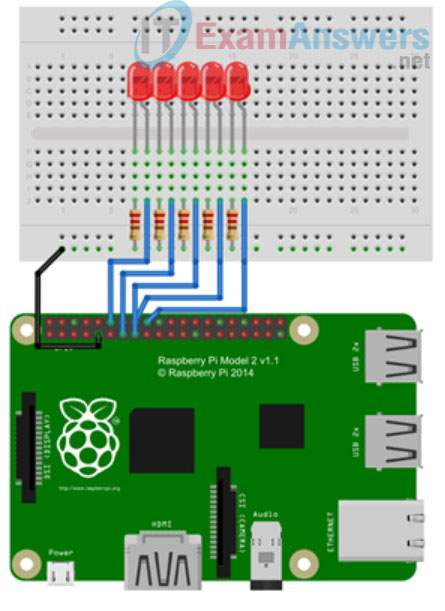
1. Insert the five LEDs to the breadboard. The cathode should be left of the anode leg for each LED.
2. Insert the five 330Ohm resistors to the breadboard. Each resistor should be aligned with the cathode leg of LED. Use the ground row to connect all resistors to the common ground.
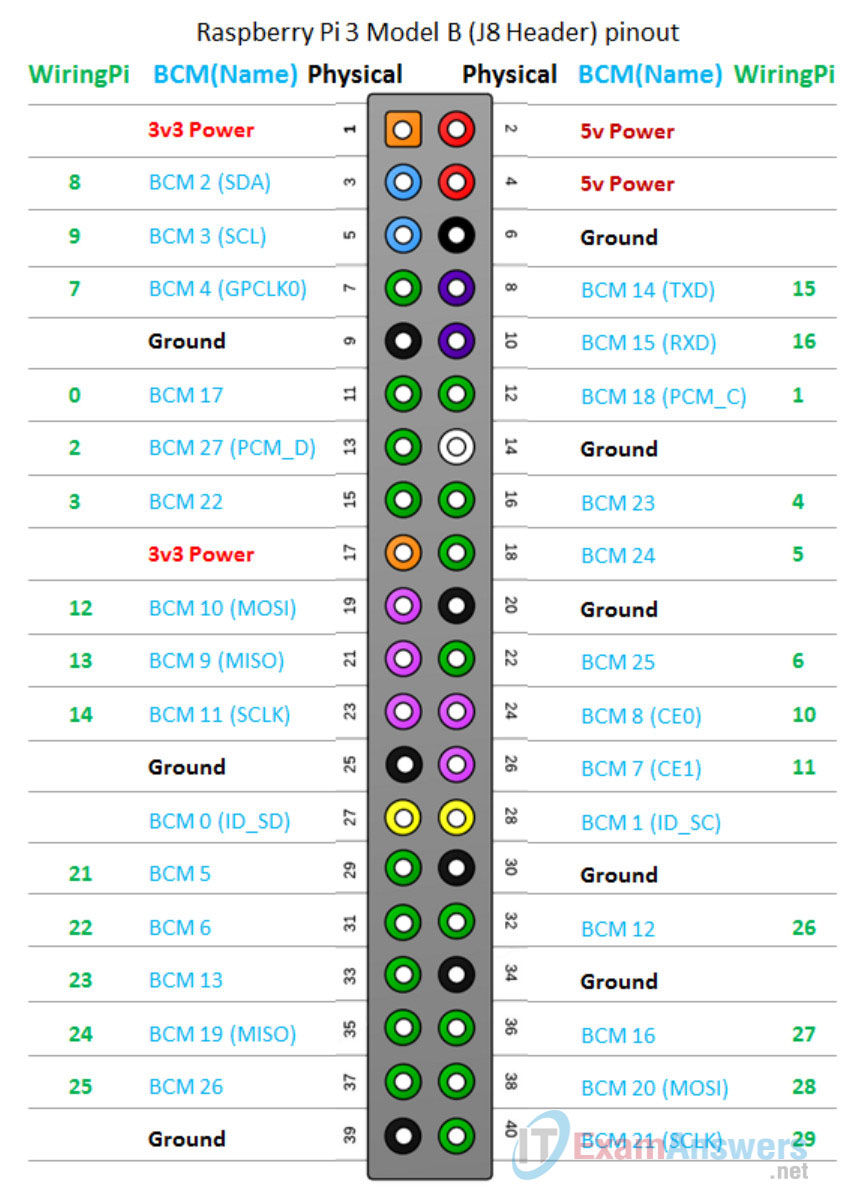
3. Connect the ground jumper wire to physical pin 9 on the Raspberry Pi. Typically, the color black is used to indicate ground.
4. Use a jumper wire to connect the anode leg of the first LED to the GPIO BCM pin number 18, located at physical pin 12.
5. Use a second jumper wire to connect the second LED to GPIO BCM pin number 27, located at physical pin 13.
6. Use a third jumper wire to connect the third LED to GPIO BCM pin number 22, located at physical pin 15.
7. Use a fourth jumper wire to connect the fourth LED to GPIO BCM pin number 23, located at physical pin 16.
8. Use a fifth jumper wire to connect the fifth LED to GPIO BCM pin number 24, located at physical pin 18. Note: It is good practice to identify circuits by color. Try using the colors of the rainbow (ROYGBIV) to match wires with LEDs.
Step 2: Add a potentiometer to a RedBoard
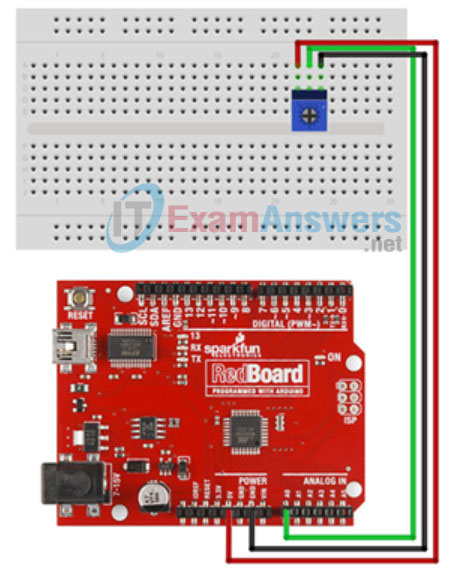
1. To simulate an analog sensor, add a 10kOhm potentiometer to the other side of the breadboard.
2. Connect a black jumper wire to a hole aligned with the right leg of the potentiometer. Connect the other end of the jumper wire to the GND on the RedBoard.
3. Connect a red jumper wire to a hole aligned with the left leg of the potentiometer. Connect the other end of the red jumper wire to the +5V output on the RedBoard.
4. Connect a green jumper wire to a hole aligned with the middle leg of the potentiometer. Connect the other end of the green jumper wire to the A0 output on the RedBoard.
5. Using a screwdriver, gently turn the knob of the potentiometer to the left, then to the right. Find the middle position and leave the knob there for now.
Step 3: Connect the RedBoard to the Raspberry Pi
Using a USB cable, connect the RedBoard to the Raspberry Pi.
Note: Since the RedBoard is powered directly from this USB connection, there is no need to provide any additional power to the RedBoard.
Part 2: Use the PL-App with Raspberry Pi and RedBoard
Step 1: Identify the RedBoard’s serial communication device on Linux
1. The RedBoard (or Arduino UNO board) is connected to the Raspberry Pi using a USB cable. The USB cable not only provides power to the RedBoard, but also provides a serial communication device that can be used to programm the RedBoard and exchnage data. On Windows the serial communication device is identified as “COM1, COM2, …” port, on Linux it’s usually /dev/ttyUSB0, /dev/ttyUSB1, … or /dev/ttyACM0, /dev/ttyACM1, …
2. Identify the name of the RedBoard serial communication device on the Linux PL-App OS, by executing the cell bellow. The cell bellow contains a bash script that idenfifies the device name. Remember the name of the serial communication device – it will be needed for later work.
Example output:

Step 2: Flashing RedBoard with Firmata firmware
Firmata is a serial communication protocol that enables to control the RedBoard (Arduino boards) over a serial interface, without the need to reflash the RedBoard every time with a new problem specific firmware.
The controlling device, in this case the PL-App Raspberry Pi uses the RedBoard’s serial communication device to send a receive Firmata messages. These messages can be for example control commands which in a human language could be represented as: “Hi RedBoard, what is the current value of the Analog Input Pin 0?“, or “Hi RedBoard, turn on the GPIO pin 13“, etc.
Flashing the Firmata firmware on a RedBoard is usually a one time operation. If the firmware on the RedBoard is not reflashed with a different code, it can always exchange data and control messages with any device that talks firmata.
- If it already contains firmwata, you can skip this step.
- If your RedBoard does not already contain the Firmata firmwata, execute the cell below.
- Make sure to set the corrent name of the RedBoard’s serial communication device (i.e. /dev/ttyUSB0, /dev/ttyACM0, …) in the flash Firmata to Arduino on port block below (or the resulting python code).
Example output:

Step 3: Create an application to read out analog values using RedBoard
1. Create the following Blockly program in the Visual Programming cell below.
A. The visual code displayed here starts with setting the BCM pin numbering scheme.
B. Setup the GPIO pins as OUTput for the pins with LEDs connected.
C. Setup Firmata communication with the RedBoard.
D. Execute a never ending loop to be repeated every 1 second.
E. Inside of the loop, read the value from the RedBoard’s analog A0 pin.
F. Based on the value, turn on or off the LEDs connected to the GPIO pins of the Raspberry Pi.
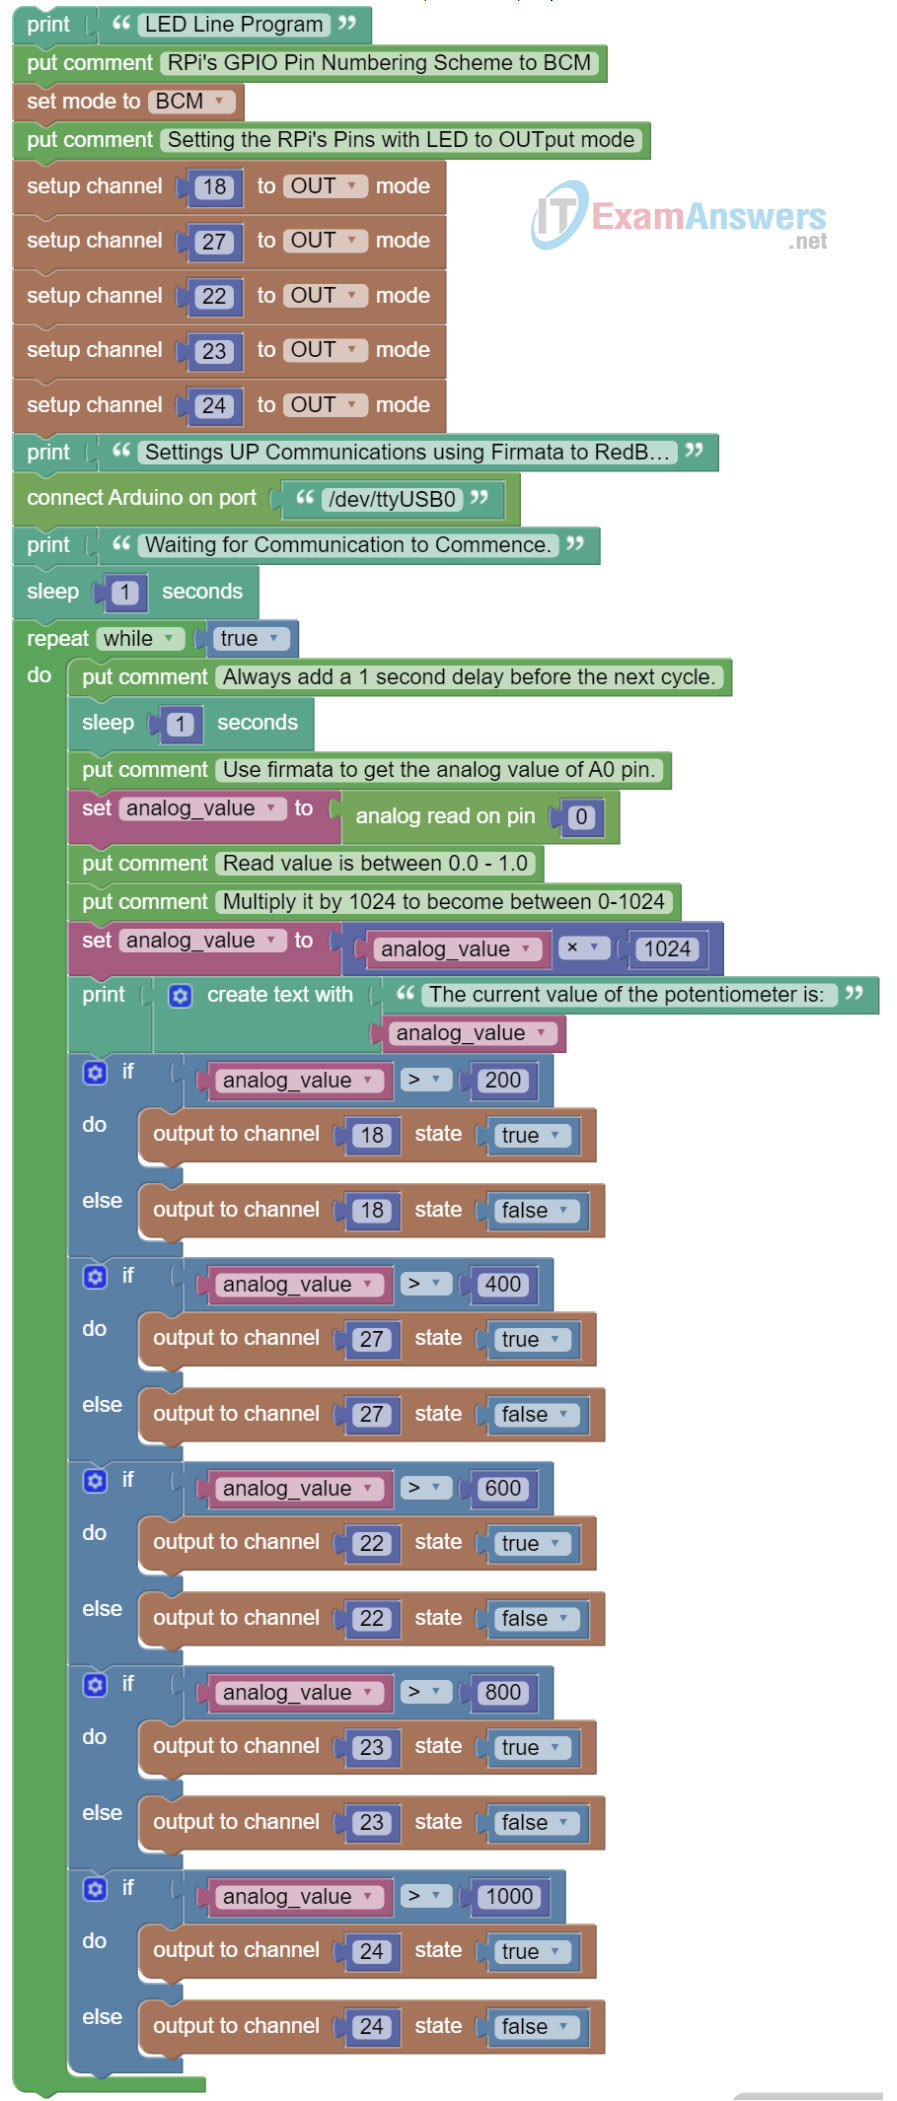
2. Run the Visual Programming cell with the Blockly code that you created. To stop the loop, pres the Stop icon next to the cell.
3. Turn the knob on the potentiometer. You should see the output values changing, as well as the LEDs turning on or off based on the current position of the knob.
4. Stop the program and return follow with the next part.
print('Hello, please update me with real code...')
Hello, please update me with real code...
Part 3: Visualize the Data in a Line Chart
Continue by updating the Visual Programming code cell that you created in the previous part.
Step 1: Create a Line Chart
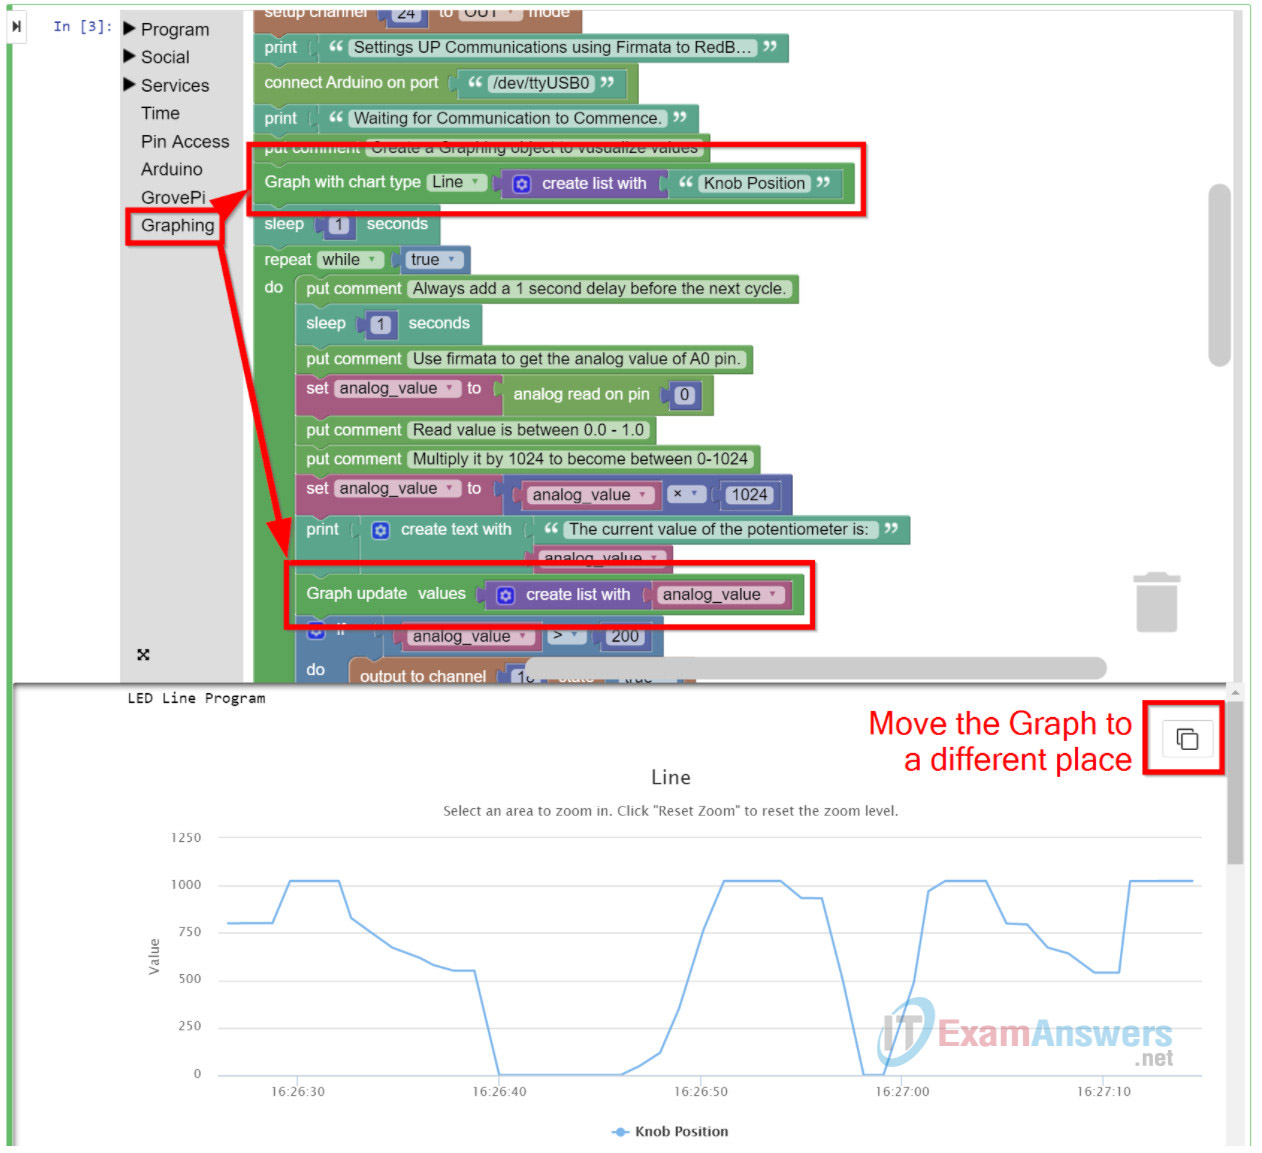
1. Click on the Graphing menu and add a Graph with chart type block to create a new Visual Graph. This block creates the Graph, it must be placed outside and before the while loop so that it is not getting redefined on every iteration of the loop.
2. By default the list of charts contains two data labels – Label 1 and Label 2. We would like to visualize the current position of the potentiometer knob and therefore one data label is enough. Remove the second label and rename the remaining one to “Knob Position”.
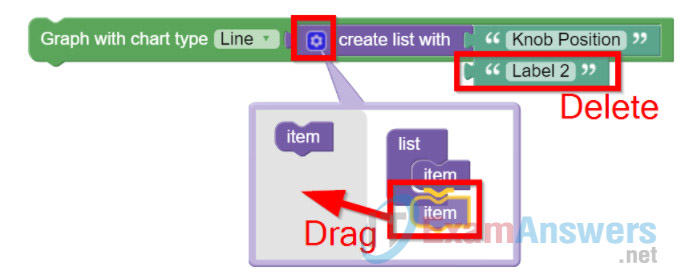
3. Click on the Graphing menu and add a Graph update values block into the while loop after reading the analog value representing the position of the potentiometer’s knob. The source data that should be visualized is the value of analog_value variable.
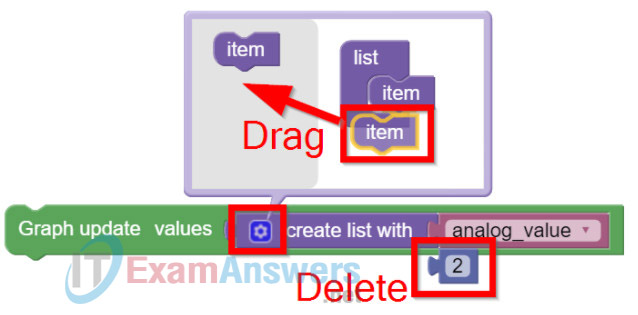
4. Run the cell. This time you should not only see a textual output, but also a realtime graph visualization. Example output:
Reflection
If you wanted to connect another LED to the Raspberry PI indicating values less than 100, what pin might you use?
Examine the resulting Python code displayed on the right part of the Visual Programming code cell. Take the Python code (copy/paste) and put it into a new cell below. Try to edit edit and customize the Python code and run the cell. See how your customizations change the behaviour
