25.0 Introduction
25.0.1 Why Should I Take this Module?
What types of data are necessary to perform security monitoring? What type of logging will be needed in order to capture the data that is necessary for security monitoring? What type of information is included in the various log files that are used to capture data for security monitoring? Read on in this module to see how network security data is collected, processed, and used to make network security decisions.
25.0.2 What Will I Learn in this Module?
Module Title: Network Security Data
Module Objective: Explain the types of network security data used in security monitoring.
| Topic Title | Topic Objective |
|---|---|
| Types of Security Data | Describe the types of data used in security monitoring. |
| End Device Logs | Describe the elements of an end device log file. |
| Network Logs | Describe the elements of a network device log file. |
25.1 Types of Security Data
25.1.1 Alert Data
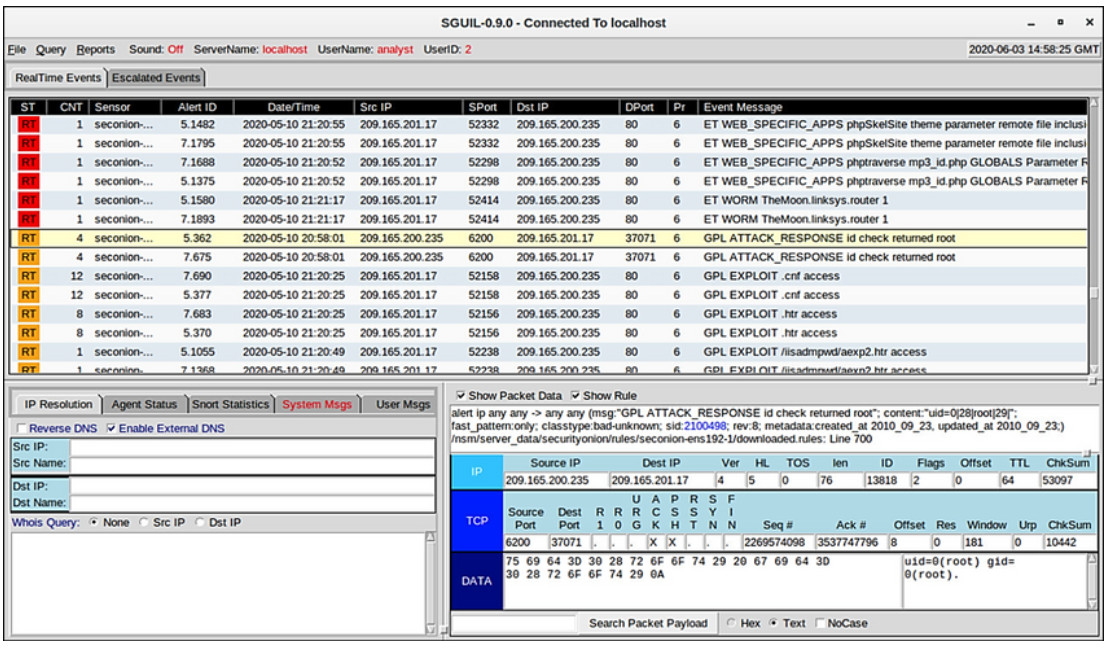
Alert data consists of messages generated by intrusion prevention systems (IPSs) or intrusion detection systems (IDSs) in response to traffic that violates a rule or matches the signature of a known exploit. A network IDS (NIDS), such as Snort, comes configured with rules for known exploits. Alerts are generated by Snort and are made readable and searchable by the Sguil and Squert applications, which are part of the Security Onion suite of NSM tools.
A testing site that is used to determine if Snort is operating is the tesmyids site. Search for it on the internet. It consists of a single webpage that displays only the following text uid=0(root) gid=0(root) groups=0(root). If Snort is operating correctly and a host visits this site, a signature will be matched and an alert will be triggered. This is an easy and harmless way to verify that the NIDS is running.
The Snort rule that is triggered is:
alert ip any any -> any any (msg:"GPL ATTACK\_RESPONSE id check returned root"; content:"uid=0|28|root|29|"; fast\_pattern:only; classtype:bad-unknown; sid:2100498; rev:8;)
This rule generates an alert if any IP address in the network receives data from an external source that contains content with text matching the pattern of uid=0(root). The alert contains the message GPL ATTACK_RESPONSE id check returned root. The ID of the Snort rule that was triggered is 2100498.
The highlighted line in the figure displays a Sguil alert that was generated by visiting the testmyids website. The Snort rule and the packet data for the content received from the testmyvids webpage is displayed in the lower right-hand area of the Sguil interface.
Sguil Console Showing Test Alert from Snort IDS
25.1.2 Session and Transaction Data
Session data is a record of a conversation between two network endpoints, which are often a client and a server. The server could be inside the enterprise network or at a location accessed over the internet. Session data is data about the session, not the data retrieved and used by the client. Session data will include identifying information such as the five tuples of source and destination IP addresses, source and destination port numbers, and the IP code for the protocol in use. Data about the session typically includes a session ID, the amount of data transferred by source and destination, and information related to the duration of the session.
Zeek, formerly Bro, is a network security monitoring tool you will use in labs later in the course. The figure shows a partial output for three HTTP sessions from a Zeek connection log. Explanations of the fields are shown below the figure.
Zeek Session Data – Partial Contents

- ts: session start timestamp
- uid: unique session ID
- id.orig_h: IP address of host that originated the session (source address)
- id.orig_p: protocol port for the originating host (source port)
- id.resp_h: IP address of host responding to the originating host (destination address)
- id.resp_p: protocol of responding host (destination port)
- proto: transport layer protocol for session
- service: application layer protocol
- duration: duration of the session
- orig_bytes: bytes from originating host
- resp_bytes: bytes from responding host
- orig_packets: packets from the originating host
- resp_packets: packets from responding host
Transaction data consists of the messages that are exchanged during network sessions. These transactions can be viewed in packet capture transcripts. Device logs kept by servers also contain information about the transactions that occur between clients and servers. For example, a session might include the downloading of content from a webserver, as shown in the figure. The transactions that represent the requests and replies would be logged in an access log on the server or by a NIDS like Zeek. The session is all traffic involved in making up the request, the transaction is the request itself.
Transaction Data
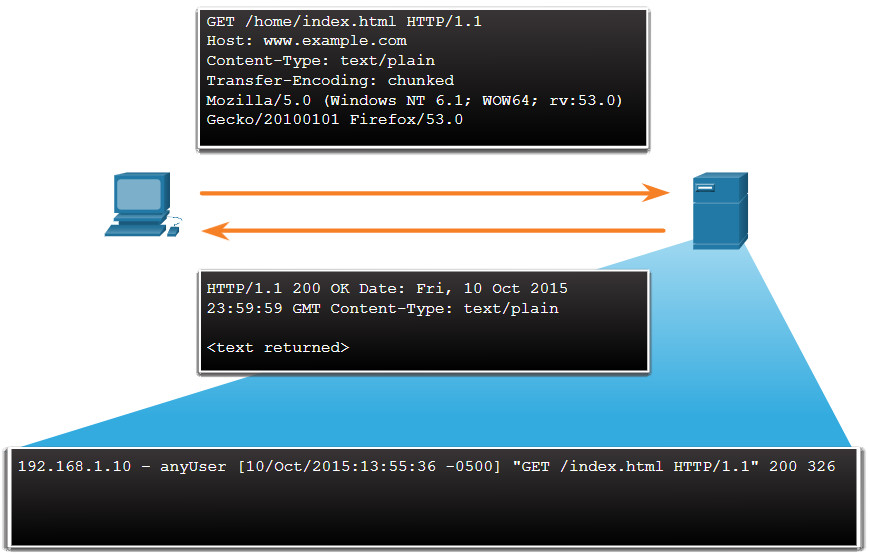
Transaction data record as a web server access log entry.
25.1.3 Full Packet Captures
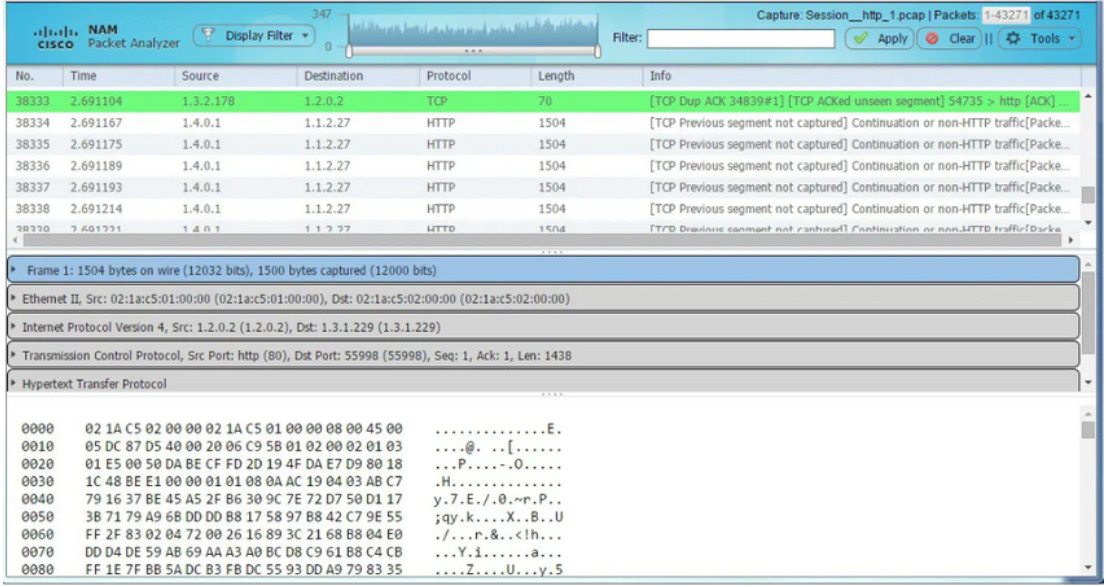
Full packet captures are the most detailed network data that is generally collected. Because of the amount of detail, they are also the most storage and retrieval intensive types of data used in NSM. Full packet captures contain not only data about network conversations, like session data. Full packet captures also contain the actual contents of the conversations. Full packet captures contain the text of email messages, the HTML in webpages, and the files that enter or leave the network. Extracted content can be recovered from full packet captures and analyzed for malware or user behavior that violates business and security policies. The familiar tool Wireshark is very popular for viewing full packet captures and accessing the data associated with network conversations.
The figure illustrates the interface for the Network Analysis Monitor component of Cisco Prime Infrastructure system, which, like Wireshark, can display full packet captures.
Cisco Prime Network Analysis Module – Full Packet Capture
25.1.4 Statistical Data
Like session data, statistical data is about network traffic. Statistical data is created through the analysis of other forms of network data. Conclusions can be made that describe or predict network behavior from these analysis. Statistical characteristics of normal network behavior can be compared to current network traffic in an effort to detect anomalies. Statistics can be used to characterize normal amounts of variation in network traffic patterns in order to identify network conditions that are significantly outside of those ranges. Statistically significant differences should raise alarms and prompt investigation.
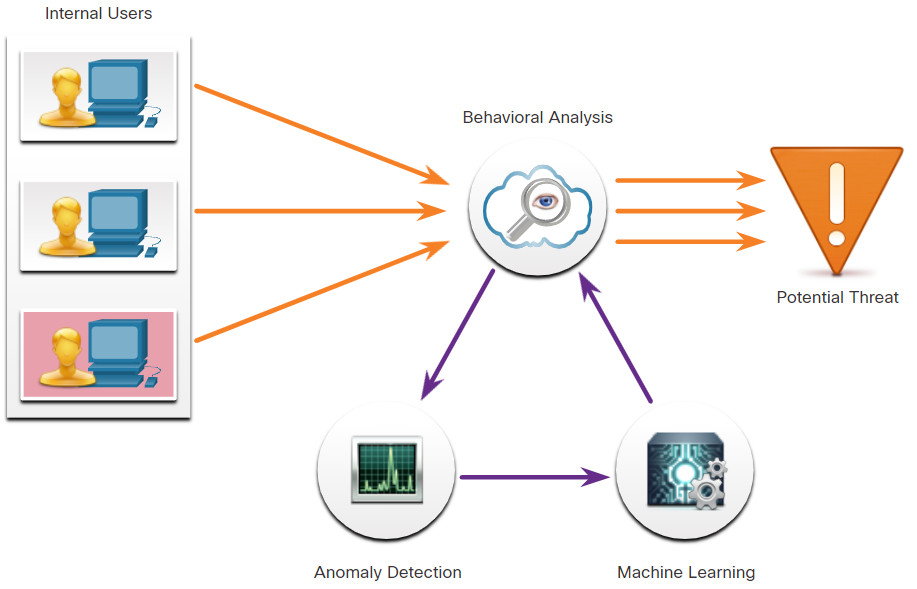
Network Behavior Analysis (NBA) and Network Behavior Anomaly Detection (NBAD) are approaches to network security monitoring that use advanced analytical techniques to analyze NetFlow or Internet Protocol Flow Information Export (IPFIX) network telemetry data. Techniques such as predictive analytics and artificial intelligence perform advanced analyses of detailed session data to detect potential security incidents.
Note: IPFIX is the IETF standard version of Cisco NetFlow version 9.
An example of an NSM tool that utilizes statistical analysis is Cisco Cognitive Threat Analytics. It is able to find malicious activity that has bypassed security controls or entered the network through unmonitored channels (including removable media) and is operating inside an organization’s environment. Cognitive Threat Analytics is a cloud-based product that uses machine learning and statistical modeling of networks. It creates a baseline of the traffic in a network and identifies anomalies. It analyzes user and device behavior, and web traffic, to discover command-and-control communications, data exfiltration, and potentially unwanted applications operating in the infrastructure. The figure illustrates an architecture for Cisco Cognitive Threat Analytics.
Cisco Cognitive Threat Analytics
25.2 End Device Logs
25.2.1 Host Logs
As previously discussed, host-based intrusion detection systems (HIDS) run on individual hosts. HIDS not only detects intrusions, but in the form of host-based firewalls, can also prevent intrusion. This software creates logs and stores them on the host. This can make it difficult to get a view of what is happening on hosts in the enterprise, so many host-based protections have a way to submit logs to centralized log management servers. In this way, the logs can be searched from a central location using NSM tools.
HIDS systems can use agents to submit logs to management servers. OSSEC, a popular open-source HIDS, includes a robust log collection and analysis functionality. Search OSSEC on the internet to learn more. Microsoft Windows includes several methods for automated host log collection and analysis. Tripwire offers a HIDS for Linux that includes similar functionality. All can scale to larger enterprises.
Microsoft Windows host logs are visible locally through Event Viewer. Event Viewer keeps four types of logs:
- Application logs – These contain events logged by various applications.
- System logs – These include events regarding the operation of drivers, processes, and hardware.
- Setup logs – These record information about the installation of software, including Windows updates.
- Security logs – These record events related to security, such as logon attempts and operations related to file or object management and access.
- Command-line logs – Attackers who have gained access to a system, and some types of malware, execute commands from the command-line interface (CLI) rather than a GUI. Logging command line execution will provide visibility into this type of incident.
Various logs can have different event types. Security logs consist only of audit success or failure messages. On Windows computers, security logging is carried out by the Local Security Authority Subsystem Service (LSASS), which is also responsible for enforcing security policies on a Windows host. LSASS runs as lsass.exe. It is frequently faked by malware. It should be running from the Windows System32 directory. If a file with this name, or a camouflaged name, such as 1sass.exe, is running or running from another directory, it could be malware.
Windows Events are identified by ID numbers and brief descriptions. An encyclopedia of security event IDs, some with additional details, is available from Ultimate Windows Security on the web.
The table explains the meaning of the five Windows host log event types.
| Event Type | Description |
|---|---|
| Error | An error is an event that indicates a significant problem such as loss of data or loss of functionality. For example, if a service fails to load during startup, an error event is logged. |
| Warning | A Warning is an event that is not necessarily significant but may indicate a possible future problem. For example, when disk space is low, a warning event is logged. If an application can recover from an event without loss of functionality or data, it can generally classify the event as a warning event. |
| Information | An information event describes the successful operation of an application, driver, or service. For example, when a network driver loads successfully, it may be appropriate to log an information event. Note that it is generally inappropriate for a desktop application to log an event each time it starts. |
| Success Audit | A success audit is an event that records an audited security access attempt that is successful. For example, a user’s successful attempt to log on to the system is logged as a success audit event. |
| Failure Audit | A failure audit is an event that records an audited security access attempt that fails. For example, if a user tries to access a network drive and fails, the attempt is logged as a failure audit event. |
Source: https://msdn.microsoft.com/en-us/library/windows/desktop/aa363662(v=vs.85).aspx
25.2.2 Syslog
Syslog incudes specifications for message formats, a client-server application structure, and network protocol. Many different types of network devices can be configured to use the syslog standard to log events to centralized syslog servers.
Syslog is a client/server protocol. Syslog was defined within the Syslog working group of the IETF (RFC 5424) and is supported by a wide variety of devices and receivers across multiple platforms.
The Syslog sender sends a small (less than 1KB) text message to the Syslog receiver. The Syslog receiver is commonly called “syslogd,” “Syslog daemon,” or “Syslog server.” Syslog messages can be sent via UDP (port 514) and/or TCP (typically, port 5000). While there are some exceptions, such as SSL wrappers, this data is typically sent in plaintext over the network.
The full format of a Syslog message that is seen on the network has three distinct parts, as shown in the figure.
- PRI (priority)
- HEADER
- MSG (message text)
The PRI consists of two elements, the Facility and Severity of the message, which are both integer values. The Facility consists of broad categories of sources that generated the message, such as the system, process, or application. The Facility value can be used by logging servers to direct the message to the appropriate log file. The Severity is a value from 0-7 that defines the severity of the message.
Syslog Packet Format

Click below to view the Syslog packet descriptions
The HEADER section of the message contains the timestamp in MMM DD HH:MM:SS format. If the timestamp is preceded by the period (.) or asterisk (*) symbols, a problem is indicated with NTP. The HEADER section also includes the hostname or IP address of the device that is the source of the message.
The MSG portion contains the meaning of the syslog message. This can vary between device manufacturers and can be customized. Therefore, this portion of the message is the most meaningful and useful to the cybersecurity analyst.
25.2.3 Server Logs
Server logs are an essential source of data for network security monitoring. Network application servers such as email and web servers keep access and error logs. DNS proxy server logs which document all the DNS queries and responses that occur on the network are especially important. DNS proxy logs are useful for identifying hosts that may have visited dangerous websites and for identifying DNS data exfiltration and connections to malware command-and-control servers. Many UNIX and Linux servers use syslog. Others may use proprietary logging. The contents of log file events depend on the type of server.
Two important log files to be familiar with are the Apache webserver access logs and Microsoft Internet Information Server (IIS) access logs. Examples of each are shown below.
Apache Access Log
203.0.113.127 – dsmith [10/Oct/2016:10:26:57 - 0500] "GET /logo_sm.gif HTTP/1.0“ 200 2254 ""http://www.example.com/links.html"" "Mozilla/5.0 (Windows NT 6.1; Win64; x64; rv:47.0) Gecko/20100101 Firefox/47.0"
IIS Access Log
6/14/2016, 16:22:43, 203.0.113.24, -, W3SVC2, WEB3, 198.51.100.10, 80, GET, /home.htm, -, 200, 0, 15321, 159, 15, HTTP/1.1, Mozilla/5.0 (compatible; MSIE 9.0; Windows Phone OS 7.5; Trident/5.0; IEMobile/9.0), -, http://www.example.com
25.2.4 SIEM and Log Collection
Security Information and Event Management (SIEM) technology is used in many organizations to provide real-time reporting and long-term analysis of security events, as shown in the figure.
SIEM Inputs and Outputs
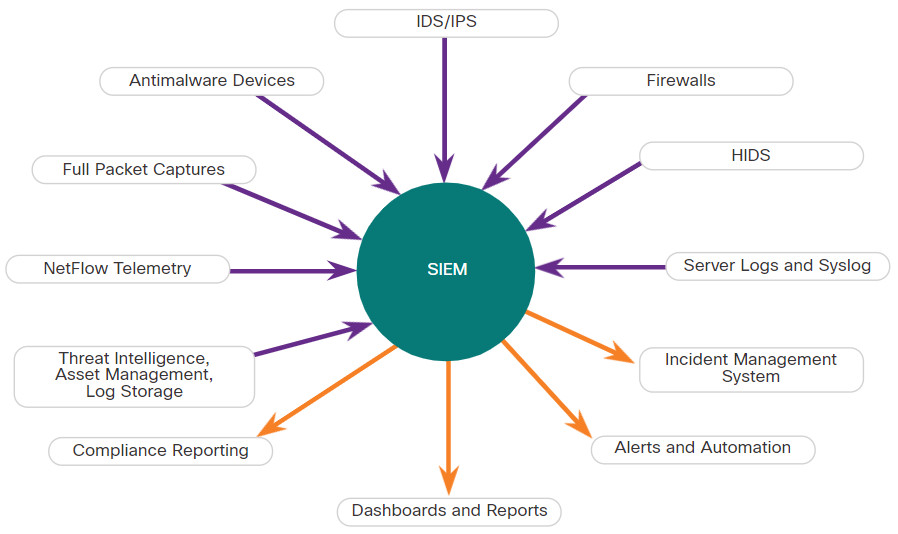
SIEM combines the essential functions of security event management (SEM) and security information management (SIM) tools to provide a comprehensive view of the enterprise network using the following functions:
- Log collection – Event records from sources throughout the organization provide important forensic information and help to address compliance reporting requirements.
- Normalization – This maps log messages from different systems into a common data model, enabling the organization to connect and analyze related events, even if they are initially logged in different source formats.
- Correlation – This links logs and events from disparate systems or applications, speeding detection of and reaction to security threats.
- Aggregation – This reduces the volume of event data by consolidating duplicate event records.
- Reporting – This presents the correlated, aggregated event data in real-time monitoring and long-term summaries, including graphical interactive dashboards.
- Compliance – This is reporting to satisfy the requirements of various compliance regulations.
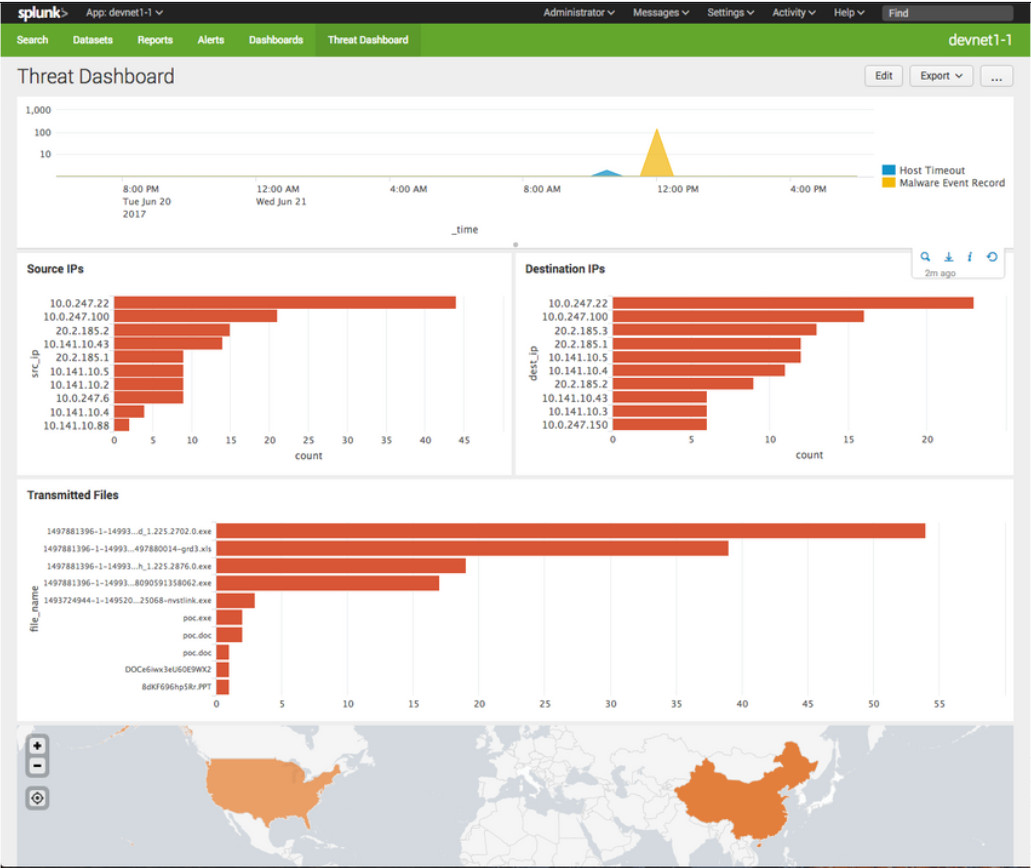
A popular SIEM is Splunk, which is made by a Cisco partner. The figure shows a Splunk Threat Dashboard. Splunk is widely used in SOCs. Another popular SIEM solution is Security Onion with ELK, which consists of the integrated Elasticsearch, Logstash, and Kibana applications. Security Onion includes other open-source network security monitoring tools.
Splunk Threat Dashboard
As we know, security orchestration, automation, and response (SOAR) takes SIEM and goes beyond into automating security response workflows and facilitating incidence response. Because of the importance of network security, numerous companies have brought excellent products to the security tools market. However, these tools lack compatibility and require monitoring multiple independent product dashboards in order to process the many alerts that they generate. Because of the lack of cybersecurity professionals to monitor and analyze the large volume of security data, it is important that tools from multiple vendors can be integrated into a single platform. Integrated security platforms go beyond SIEM and SOAR to unify multiple security technologies, processes, and people into a unified team whose components build on rather than impede each other. Security platforms such as Cisco SecureX, Fortinet Security Fabric, and Paloalto Networks Cortex XDR promise to address network security monitoring complexity by integrating multiple functions and data sources into a single platform that will greatly enhance alert accuracy while offering robust defense.
25.3 Network Logs
25.3.1 Tcpdump
A Large Broadcast Domain

The tcpdump command line tool is a very popular packet analyzer. It can display packet captures in real time or write packet captures to a file. It captures detailed packet protocol and content data. Wireshark is a GUI built on tcpdump functionality.
The structure of tcpdump captures varies depending on the protocol captured and the fields requested.
25.3.2 NetFlow
NetFlow is a protocol that was developed by Cisco as a tool for network troubleshooting and session-based accounting. NetFlow efficiently provides an important set of services for IP applications, including network traffic accounting, usage-based network billing, network planning, security, Denial-of-Service monitoring capabilities, and network monitoring. NetFlow provides valuable information about network users and applications, peak usage times, and traffic routing.
NetFlow does not do a full packet capture or capture the actual content in the packet. NetFlow records information about the packet flow including metadata. Cisco developed NetFlow and then allowed it to be used as a basis for an IETF standard called IPFIX. IPFIX is based on Cisco NetFlow Version 9.
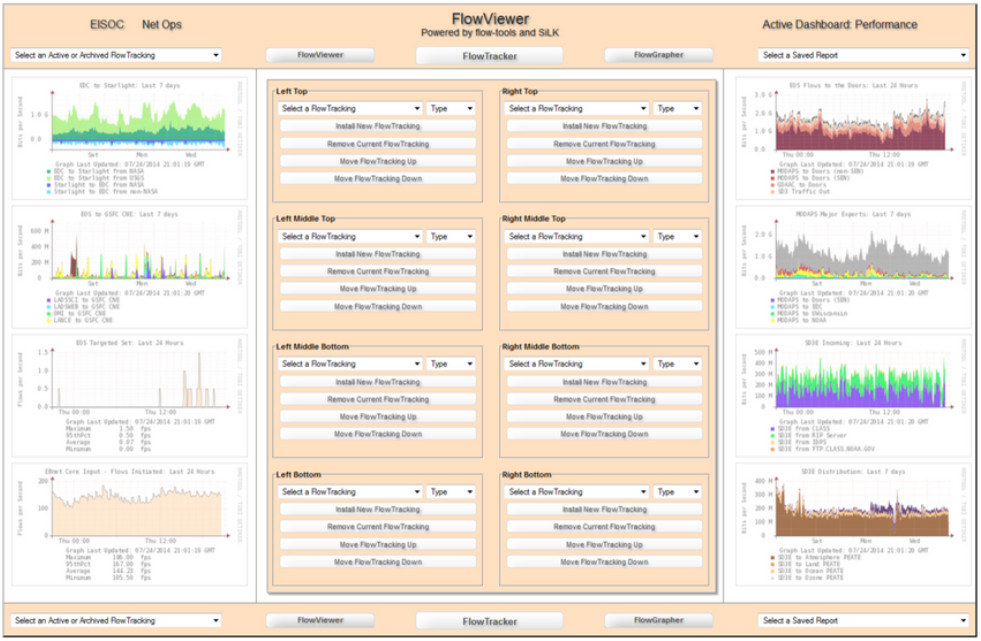
NetFlow information can be viewed with tools such as the nfdump. Similar to tcpdump, nfdump provides a command line utility for viewing NetFlow data from the nfcapd capture daemon, or collector. Tools exist that add GUI functionality to viewing flows. The figure shows a screen from the open source FlowViewer tool.
FlowViewer NetFlow Session Data Dashboard
Traditionally, an IP Flow is based on a set of 5 to 7 IP packet attributes flowing in a single direction. A flow consists of all packets transmitted until the TCP conversation terminates. IP Packet attributes used by NetFlow are:
- IP source address
- IP destination address
- Source port
- Destination port
- Layer 3 protocol type
- Class of Service
- Router or switch interface
All packets with the same source/destination IP address, source/destination ports, protocol interface and class of service are grouped into a flow, and then packets and bytes are tallied. This methodology of fingerprinting or determining a flow is scalable because a large amount of network information is condensed into a database of NetFlow information called the NetFlow cache.
All NetFlow flow records will contain the first five items in the list above, and flow start and end timestamps. The additional information that may appear is highly variable and can be configured on the NetFlow Exporter device. Exporters are devices that can be configured to create flow records and transmit those flow records for storage on a NetFlow collector device. An example of a basic NetFlow flow record, in two different formats, is shown in the figure.
Simple NetFlow v5 Records
Date flow start Duration Proto Src IP Addr:Port Dst IP Addr:Port Flags Tos Packets Bytes Flows2017-08-30 00:09:12.596 00.010 TCP 10.1.1.2:80 -> 13.1.1.2:8974 .AP.SF 0 62 3512 1
Traffic Contribution: 8% (3/37)Flow information:IPV4 SOURCE ADDRESS:10.1.1.2IPV4 DESTINATION ADDRESS:13.1.1.2INTERFACE INPUT:Se0/0/1TRNS SOURCE PORT:8974TRNS DESTINATION PORT:80IP TOS:0x00IP PROTOCOL:6FLOW SAMPLER ID:0FLOW DIRECTION:Inputipv4 source mask:/0ipv4 destination mask:/8counter bytes:205ipv4 next hop address:13.1.1.2tcp flags:0x1binterface output:Fa0/0counter packets:5timestamp first:00:09:12.596timestamp last:00:09:12.606ip source as:0ip destination as:0
A large number of attributes for a flow are available. The IANA registry of IPFIX entities lists several hundred, with the first 128 being the most common.
Although NetFlow was not initially conceived as tool for network security monitoring, it is seen as a useful tool in the analysis of network security incidents. It can be used to construct a timeline of compromise, understand individual host behavior, or to track the movement of an attacker or exploit from host to host within a network. The Cisco/Lancope Stealthwatch technology enhances the use of NetFlow data for NSM.
25.3.3 Application Visibility and Control
The Cisco Application Visibility and Control (AVC) system, which is shown in the figure, combines multiple technologies to recognize, analyze, and control over 1000 applications. These include voice and video, email, file sharing, gaming, peer-to-peer (P2P), and cloud-based applications. AVC uses Cisco next-generation network-based application recognition version 2 (NBAR2), also known as Next-Generation NBAR, to discover and classify the applications in use on the network. The NBAR2 application recognition engine supports over 1000 network applications.
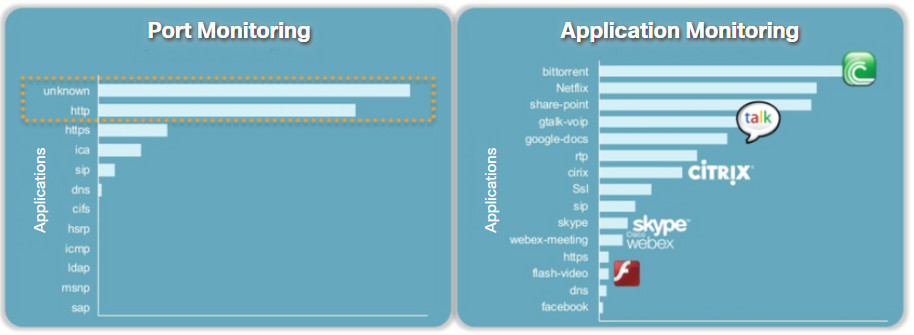
To truly understand the importance of this technology, consider the figure. Identification of network applications by port provides very little granularity and visibility into user behavior. However, application visibility through the identification of application signatures identifies what users are doing, whether it be teleconferencing or downloading movies to their phones.
Cisco Application Visibility and Control
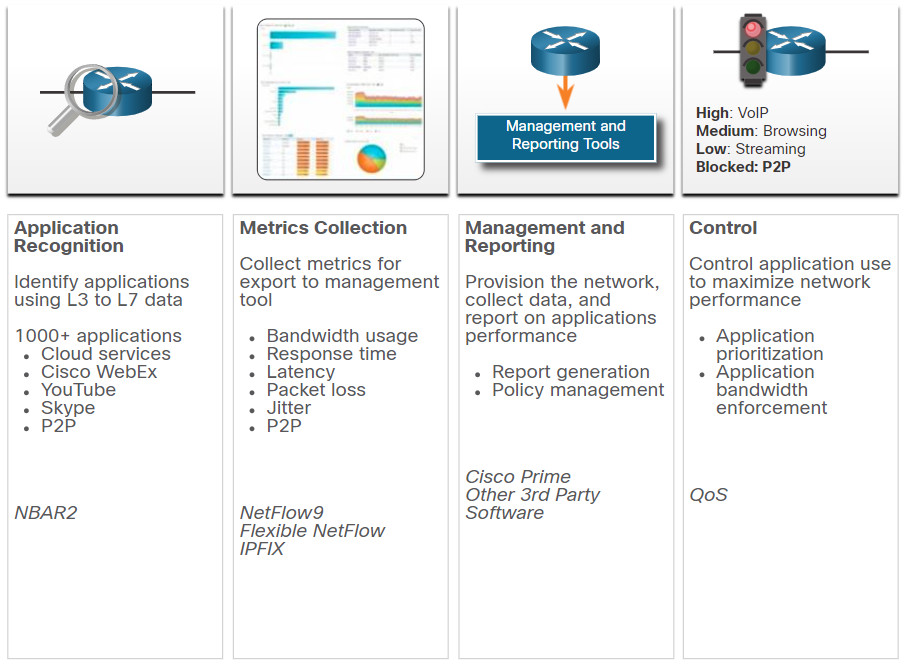
A management and reporting system, such as Cisco Prime, analyzes and presents the application analysis data into dashboard reports for use by network monitoring personnel. Application usage can also be controlled through quality of service classification and policies based on the AVC information.
Port Monitoring vs. Application Monitoring
25.3.4 Content Filter Logs
Devices that provide content filtering, such as the Cisco Email Security Appliance (ESA) and the Cisco Web Security Appliance (WSA), provide a wide range of functionalities for security monitoring. Logging is available for many of these functionalities.
The ESA, for example, has more than 30 logs that can be used to monitor most aspects of email delivery, system functioning, antivirus, antispam operations, and blacklist and whitelist decisions. Most of the logs are stored in text files and can be collected on syslog servers, or can be pushed to FTP or SCP servers. In addition, alerts regarding the functioning of the appliance itself and its subsystems can be monitored by email to administrators who are responsible for monitoring and operating the device.
WSA devices offer a similar depth of functioning. WSA effectively acts as a web proxy, meaning that it logs all inbound and outbound transaction information for HTTP traffic. These logs can be quite detailed and are customizable. They can be configured in a W3C compatibility format. The WSA can be configured to submit the logs to a server in various ways, including syslog, FTP, and SCP.
Other logs that are available to the WSA include ACL decision logs, malware scan logs, and web reputation filtering logs.
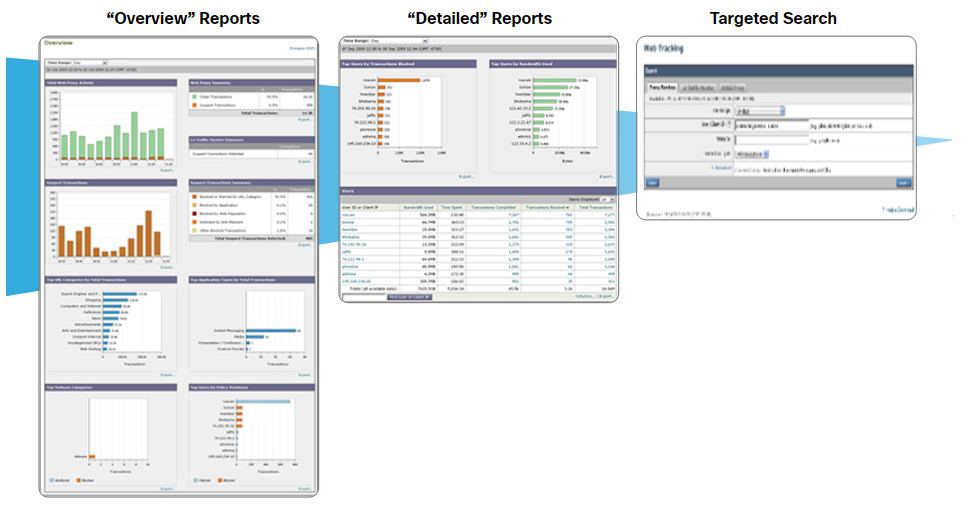
The figure illustrates the “drill-down” dashboards available from Cisco content filtering devices. By clicking components of the Overview reports, more relevant details are displayed. Target searches provide the most focused information.
25.3.5 Logging from Cisco Devices
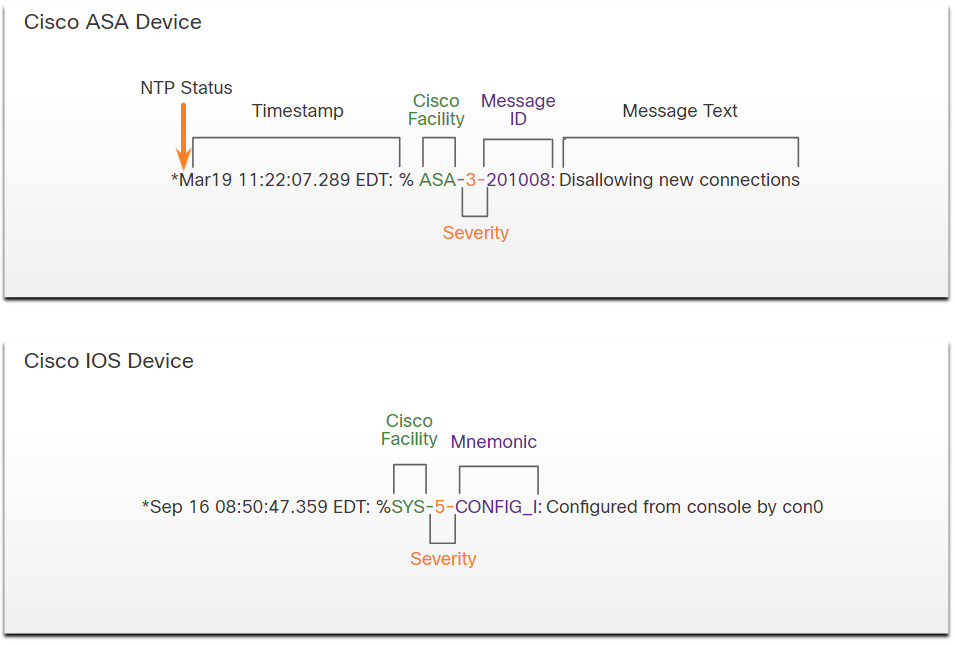
Cisco security devices can be configured to submit events and alerts to security management platforms using SNMP or syslog. The figure illustrates a syslog message generated by a Cisco ASA device and a syslog message generated by a Cisco IOS device.
Cisco Syslog Message Formats
Note that there are two meanings used for the term facility in Cisco syslog messages. The first is the standard set of Facility values that were established by the syslog standards. These values are used in the PRI message part of the syslog packet to calculate the message priority. Cisco uses some of the values between 15 and 23 to identify Cisco log Facilities, depending on the platform. For example, Cisco ASA devices use syslog Facility 20 by default, which corresponds to local4. The other Facility value is assigned by Cisco and occurs in the MSG part of the syslog message.
Cisco devices may use slightly different syslog message formats, and may use mnemonics instead of message IDs, as shown in the figure. A dictionary of Cisco ASA syslog messages is available on the Cisco website.
25.3.6 Proxy Logs
Proxy servers, such as those used for web and DNS requests, contain valuable logs that are a primary source of data for network security monitoring.
Proxy servers are devices that act as intermediaries for network clients. For example, an enterprise may configure a web proxy to handle web requests on the behalf of clients. Instead of requests for web resources being sent directly to the server from the client, the request is sent to a proxy server first. The proxy server requests the resources and returns them to the client. The proxy server generates logs of all requests and responses. These logs can then be analyzed to determine which hosts are making the requests, whether the destinations are safe or potentially malicious, and to also gain insights into the kind of resources that have been downloaded.
Web proxies provide data that helps determine whether responses from the web were generated in response to legitimate requests or have been manipulated to appear to be responses but are in fact exploits. It is also possible to use web proxies to inspect outgoing traffic as means of data loss prevention (DLP). DLP involves scanning outgoing traffic to detect whether the data that is leaving the web contains sensitive, confidential, or secret information. Examples of popular web proxies are Squid, CCProxy, Apache Traffic Server, and WinGate.
An example of a Squid web proxy log in the Squid-native forma appears below. Explanations of the field values appear in the table below the log entry.
DNS Proxy Log Example
1265939281.764 19478 172.16.167.228 TCP_MISS/200 864 GEThttp://www.example.com//images/home.png - NONE/- image/png
| Proxy Log Value | Explanation |
|---|---|
| 1265939281.764 | Time – in Unix epoch timestamp format with milliseconds |
| 19478 | Duration – the elapsed time for the request and response from Squid |
| 172.16.167.228 | Client IP address |
| TCP_MISS/200 | Result – Squid result codes and HTTP status code separated by a slash |
| 864 | Size – the bytes of data delivered |
| GET | Request – HTTP request made by the client |
| http://www.example.com//images/home.png | URI/URL – address of the resource that was requested |
| – | Client identity – RFC 1413 value for the client that made the request. Not used by default. |
| NONE/- | Peering code/Peer host – neighbor cache server consulted |
| image/png | Type – MIME content type from the Content-Type value in the HTTP response header |
Note: Open web proxies, which are proxies that are available to any internet user, can be used to obfuscate threat actor IP addresses. Open proxy addresses may be used in blacklisting internet traffic.
Cisco Umbrella
Cisco Umbrella, formerly OpenDNS, offers a hosted DNS service that extends the capability of DNS to include security enhancements. Rather than organizations hosting and maintaining blacklisting, phishing protection, and other DNS-related security, Cisco Umbrella provides these protections in its own DNS service. Cisco Umbrella is able to apply many more resources to managing DNS than most organizations can afford. Cisco Umbrella functions in part as a DNS super proxy in this regard. The Cisco Umbrella suite of security products apply real-time threat intelligence to managing DNS access and the security of DNS records. DNS access logs are available from Cisco Umbrella for the subscribed enterprise. Instead of using local or ISP DNS servers, an organization can choose to subscribe to Cisco Umbrella for DNS and other security services. An example of a DNS proxy log appears below. The table explains the meaning of the fields in the log entry.
DNS Proxy Log Example
"2015-01-16 17:48:41","ActiveDirectoryUserName",
"ActiveDirectoryUserName,ADSite,Network",
"10.10.1.100","24.123.132.133","Allowed","1 (A)",
"NOERROR","domain-visited.com.",
"Chat,Photo Sharing,Social Networking,Allow List"
| Field | Example | Explanation |
|---|---|---|
| Timestamp | 2015-01-16 17:48:41 | This is when this request was made in UTC. This is different than the Umbrella dashboard, which converts the time to your specified time zone. |
| Policy Identity | ActiveDirectoryUserName | The first identity that matched the request. |
| Identities | ActiveDirectoryUserName,ADSite,Network | All identities associated with this request. |
| Internal Ip | 10.10.1.100 | The internal IP address that made the request. |
| External Ip | 24.123.132.133 | The external IP address that made the request. |
| Action | Allowed | Whether the request was allowed or blocked. |
| QueryType | 1 (A) | The type of DNS request that was made. |
| ResponseCode | NOERROR | The DNS return code for this request. |
| Domain | domain-visited.com. | This is the domain that was requested. |
| Categories | Chat,Photo Sharing,Social Networking | The security or content categories that the destination matches. |
25.3.7 Next-Generation Firewalls
Next-Generation or NextGen Firewall devices extend network security beyond IP addresses and Layer 4 port numbers to the application layer and beyond. NexGen Firewalls are advanced devices that provided much more functionality than previous generations of network security devices. One of those functionalities is reporting dashboards with interactive features that allow quick point-and-click reports on very specific information without the need for SIEM or other event correlators.
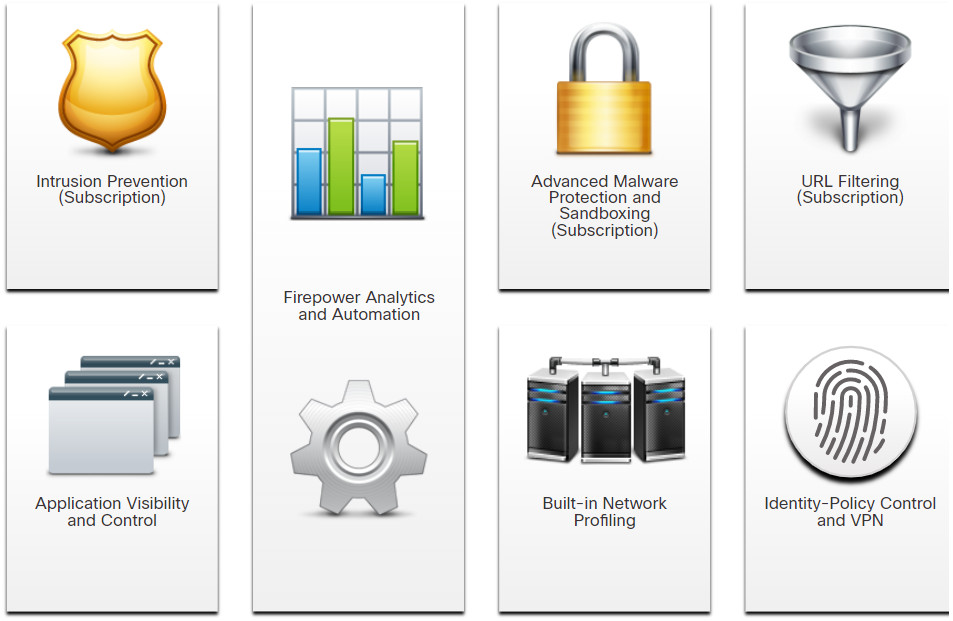
Cisco’s line of NextGen Firewall devices (NGFW) use Firepower Services to consolidate multiple security layers into a single platform. This helps to contain costs and simplify management. Firepower services include application visibility and control, Firepower Next-Generation IPS (NGIPS), reputation and category-based URL filtering, and Advanced Malware Protection (AMP). Firepower devices allow monitoring network security through a web-enabled GUI called Event Viewer.
Common NGFW events include:
- Connection Event – Connection logs contain data about sessions that are detected directly by the NGIPS. Connection events include basic connection properties such as timestamps, source and destination IP addresses, and metadata about why the connection was logged, such as which access control rule logged the event.
- Intrusion Event – The system examines the packets that traverse the network for malicious activity that could affect the availability, integrity, and confidentiality of a host and its data. When the system identifies a possible intrusion, it generates an intrusion event, which is a record of the date, time, type of exploit, and contextual information about the source of the attack and its target.
- Host or Endpoint Event – When a host appears on the network it can be detected by the system and details of the device hardware, IP addressing, and the last known presence on the network can be logged.
- Network Discovery Event – Network discovery events represent changes that have been detected in the monitored network. These changes are logged in response to network discovery policies that specify the kinds of data to be collected, the network segments to be monitored, and the hardware interfaces of the device that should be used for event collection.
- Netflow Event -Network discovery can use a number of mechanisms, one of which is to use exported NetFlow flow records to generate new events for hosts and servers.
Services Provided by NGFW
25.3.10 Packet Tracer – Explore a NetFlow Implementation
In this Packet Tracer activity, you will explore an implementation of NetFlow.
25.3.11 Packet Tracer – Logging from Multiple Sources
In this activity, you will use Packet Tracer to compare network data generated by multiple sources including syslog, AAA, and NetFlow.
25.4 Network Security Data Summary
25.4.1 What Did I Learn in this Module?
Types of Security Data
Alert data consists of messages that are generated by intrusion prevention systems (IPSs) or intrusion detection systems (IDSs) in response to traffic that violates a rule or matches the signature of a known exploit. Within the Security Onion suite of NSM tools, alerts are generated by Snort and are made readable and searchable by the Sguil, Squert, and Kibana applications.
Session data is a record of a conversation between two network endpoints, which are often a client and a server. The server could be inside the enterprise network or at a location accessed over the internet. Session data will include identifying information such as the five tuples of source and destination IP addresses, source and destination port numbers, and the IP code for the protocol in use. Data about the session typically includes a session ID, the amount of data transferred by source and destination, and information related to the duration of the session.
Full packet captures are the most detailed network data that is generally collected. Full packet captures require the greatest storage. Full packet captures contain the actual contents of data conversations, such as the text of email messages, the HTML in webpages, and the files that enter or leave the network. Extracted content can be recovered from full packet captures and be analyzed for malware or user behavior that violates business and security policies.
Statistical data is created through the analysis of various forms of network data. Statistical characteristics of normal network behavior can be compared to current network traffic in an effort to detect anomalies. Statistics can be used to characterize normal amounts of variation in network traffic patterns in order to identify network conditions that are significantly outside of those ranges. Statistically significant differences should raise alarms and prompt investigation.
End Device Logs
Host-based intrusion detection systems (HIDS) run on individual hosts. HIDS not only detects intrusions, but in the form of host-based firewalls, can also prevent intrusion. This software creates logs and stores them on the host. Many host-based protections have a way to submit logs to centralized log management servers providing a way for logs to be searched from a central location using NSM tools. OSSEC, a popular open-source HIDS, includes a robust log collection and analysis functionality.
Syslog incudes specifications for message formats, a client-server application structure, and network protocol. Many different types of network devices can be configured to use the syslog standard to log events to centralized syslog servers.
Server logs are an essential source of data for network security monitoring. Network application servers such as email and web servers keep access and error logs. DNS proxy server logs document all the DNS queries and responses that occur on the network. DNS proxy logs are useful for identifying hosts that may have visited dangerous websites and for identifying DNS data exfiltration and connections to malware command-and-control servers.
SIEM combines the essential functions of security event management (SEM) and security information management (SIM) tools to provide a comprehensive view of the enterprise network using log collection, normalization, correlation, aggregation, reporting, and compliance.
Network Logs
The tcpdump command line tool is a very popular packet analyzer. It can display packet captures in real time or write packet captures to a file. Captures include detailed packet protocol and content data that can be viewed with Wireshark.
NetFlow efficiently provides an important set of services in a session-based format for IP applications, including network traffic accounting, usage-based network billing, network planning, security, Denial-of-Service monitoring capabilities, and network monitoring. NetFlow provides valuable information about network users and applications, peak usage times, and traffic routing.
Cisco Application Visibility and Control uses Cisco next-generation network-based application recognition version 2 (NBAR2), also known as Next-Generation NBAR, to discover and classify the applications in use on the network. The NBAR2 application recognition engine supports over 1000 network applications.
Devices such as the Cisco Email Security Appliance (ESA) and the Cisco Web Security Appliance (WSA), provide a wide range of functionalities for security monitoring by utilizing content filtering. Logging is available for many of these functionalities.
Proxy servers are devices that act as intermediaries for network clients. An enterprise may configure a web proxy to handle web requests on the behalf of clients. Instead of requests for web resources being sent directly to the server from the client, the request is sent to a proxy server first. The proxy server requests the resources and returns them to the client. The proxy server generates logs of all requests and responses that can be analyzed to determine which hosts are making the requests, whether the destinations are safe or potentially malicious, and to also gain insights into the kind of resources that have been downloaded.
NextGen Firewall devices extend network security beyond IP addresses and Layer 4 port numbers to the application layer and beyond. NexGen Firewalls are advanced devices that provide much more functionality than previous generations of network security devices. NextGen Firewall reporting dashboards with interactive features allow quick point-and-click reports on very specific information without the need for SIEM or other event correlators.
