15.0 Introduction
15.0.1 Why Should I Take this Module?
Since all networks are under attack, it is important for you to understand network monitoring and network monitoring tools to help you defend and protect the network. Read more to learn about these methods and tools!
15.0.2 What Will I Learn in this Module?
Module Title: Network Monitoring and Tools
Module Objective: Explain network traffic monitoring.
| Topic Title | Topic Objective |
|---|---|
| Introduction to Network Monitoring | Explain the importance of network monitoring. |
| Introduction to Network Monitoring Tools | Explain how network monitoring is conducted. |
15.0.3 Class Activity – What’s Going On?
In this activity, you will identify the processes running on a computer, the protocol they are using, and their local and remote port addresses.
15.0.3 Class Activity – What’s Going On
15.1 Introduction to Network Monitoring
15.1.1 Network Security Topology
“All networks are targets” is a common adage used to describe the current landscape of network security. Therefore, to mitigate threats, all networks must be secured and protected.
This requires a defense-in-depth approach. It requires using proven methods and a security infrastructure consisting of firewalls, intrusion detection systems (IDS), intrusion prevention systems (IPS), and endpoint security software. These methods and technologies are used to introduce automated monitoring to the network, create security alerts, or automatically block offensive devices when something goes wrong.
However, for large networks, an extra layer of protection must be added. Devices such as firewalls and IPS operate based on pre-configured rules. They monitor traffic and compare it against the configured rules. If there is a match, the traffic is handled according to the rule. This works relatively seamlessly. However, sometimes legitimate traffic is mistaken for unauthorized traffic. Called false positives, these situations require human eyes to see and evaluate them before they can be validated.
An important part of the job of the cybersecurity analyst is to review all alerts generated by network devices and determine the validity of the alerts. Was that file that was downloaded by user X really malware? Is that website that was visited by user Y really malicious? Is the printer on the third floor really compromised because it is trying to connect to a server that is out on the internet? These are questions that are commonly asked by security analysts daily. It is their job to determine the correct answers.
15.1.2 Network Monitoring Methods
The day-to-day operation of a network consists of common patterns of traffic flow, bandwidth usage, and resource access. Together, these patterns identify normal network behavior. Security analysts must be intimately familiar with normal network behavior because abnormal network behavior typically indicates a problem.
To determine normal network behavior, network monitoring must be implemented. Various tools are used to help discover normal network behavior including IDS, packet analyzers, SNMP, NetFlow, and others.
Some of these tools require captured network data. There are two common methods used to capture traffic and send it to network monitoring devices:
- Network taps, sometimes known as test access points (TAPs)
- Traffic mirroring using Switch Port Analyzer (SPAN) or other port mirroring.
15.1.3 Network Taps
A network tap is typically a passive splitting device implemented inline between a device of interest and the network. A tap forwards all traffic, including physical layer errors, to an analysis device while also allowing the traffic to reach its intended destination.
The figure displays a sample topology displaying a tap installed between a network firewall and the internal router.
Implementing a TAP in a Sample Network
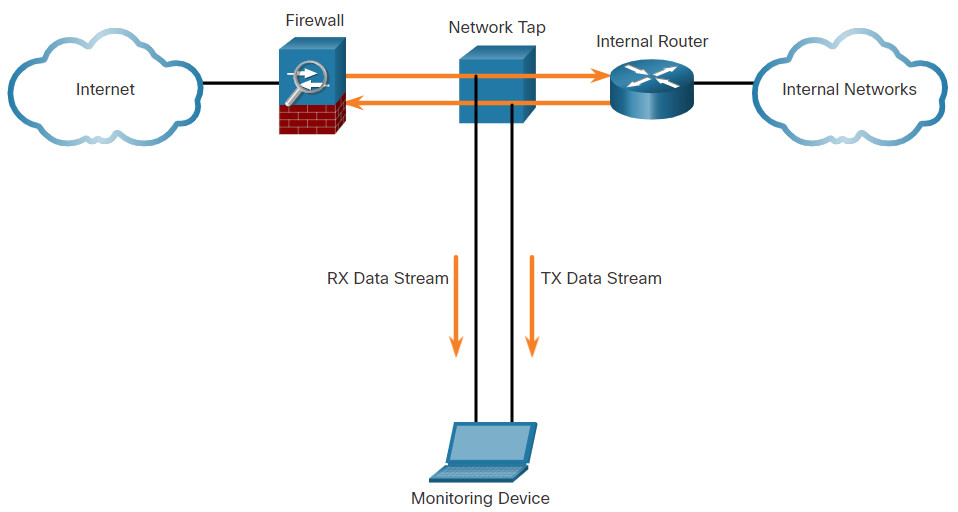
Notice how the tap simultaneously sends both the transmit (TX) data stream from the internal router and the receive (RX) data stream to the internal router on separate, dedicated channels. This ensures that all data arrives at the monitoring device in real time. Therefore, network performance is not affected or degraded by monitoring the connection.
Taps are also typically fail-safe, which means if a tap fails or loses power, traffic between the firewall and internal router is not affected.
Search the internet for information on NetScout Taps for copper UTP Ethernet, fiber Ethernet, and serial links.
15.1.4 Traffic Mirroring and SPAN
Network switches segment the network by design. This limits the amount of traffic that is visible to network monitoring devices. Because capturing data for network monitoring requires all traffic to be captured, special techniques must be employed to bypass the network segmentation imposed by network switches. Port mirroring is one of these techniques. Supported by many enterprise switches, port mirroring enables the switch to copy frames that are received on one or more ports to a Switch Port Analyzer (SPAN) port that is connected to an analysis device.
The table identifies and describes terms used by the SPAN feature.
| SPAN Term | Description |
|---|---|
| Ingress traffic | Traffic that enters the switch. |
| Egress traffic | Traffic that leaves the switch. |
| Source (SPAN) port | Source ports are monitored as traffic entering them is replicated (mirrored) to the destination ports. |
| Destination (SPAN) port | A port that mirrors source ports. Destination SPAN ports often connect to analysis devices such as a packet analyzer or an IDS. |
The figure shows a switch that interconnects two hosts and mirrors traffic to an intrusion detection device (IDS) and network management server.
SPAN
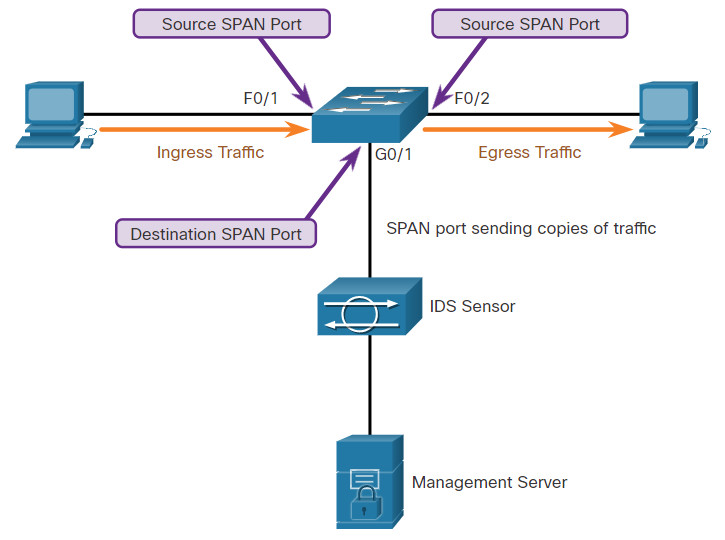
The switch will forward ingress traffic on F0/1 and egress traffic on F0/2 to the destination SPAN port G0/1 that connects to an IDS.
The association between source ports and a destination port is called a SPAN session. In a single session, one or multiple ports can be monitored. On some Cisco switches, session traffic can be copied to more than one destination port. Alternatively, a source VLAN can be specified in which all ports in the source VLAN become sources of SPAN traffic. Each SPAN session can have ports or VLANs as sources, but not both.
Note: A variation of SPAN called Remote SPAN (RSPAN) enables a network administrator to use the flexibility of VLANs to monitor traffic on remote switches.
15.2 Introduction to Network Monitoring Tools
15.2.1 Network Security Monitoring Tools
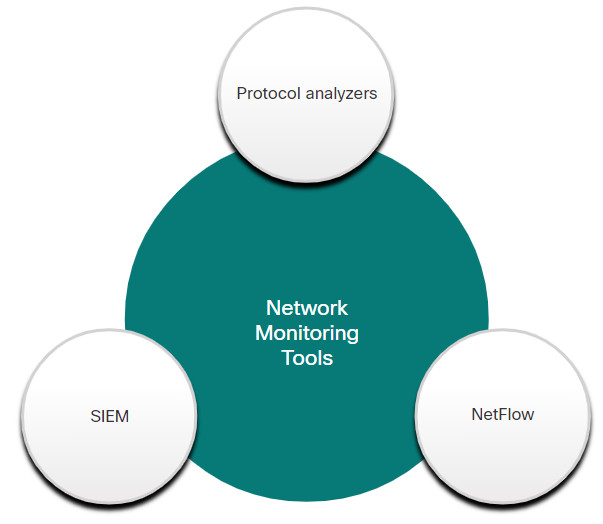
Common tools that are used for network security monitoring include:
- Network protocol analyzers such as Wireshark and Tcpdump
- NetFlow
- Security Information and Event Management Systems (SIEM)
It is also common for security analysts to rely on log files and Simple Network Management Protocol (SNMP) for network behavior discovery.
Practically all systems generate log files to record and communicate their operations. By closely monitoring log files, a security analyst can gather extremely valuable information.
SNMP allows analysts to request and receive information about the operation of network devices. It is another good tool for monitoring the behavior of a network.
Security analysts must be familiar with all of these tools.
Common Network Security Monitoring Tools
15.2.2 Network Protocol Analyzers
Network protocol analyzers (or “packet sniffer” applications) are programs used to capture traffic. Protocol analyzers show what is happening on the network, often through a graphical user interface. Analysts can use these applications to see network exchanges down to the packet level. If a computer has been infected with malware and is currently attacking other computers in the network, the analyst can see that clearly by capturing real-time network traffic and analyzing the packets.
Not only are network protocol analyzers used for security analysis. They are also very useful for network troubleshooting, software and protocol development, and education. For instance, in security forensics, a security analyst may attempt to reconstruct an incident from relevant packet captures.
Wireshark, shown in the figure, is a very popular network protocol analyzer tool that is used in Windows, Linux, and Mac OS environments. Wireshark is free software that can be downloaded and used by anyone. It is a very useful tool for learning about network protocol communications. Network protocol analyzer skills are essential for cybersecurity analysts.
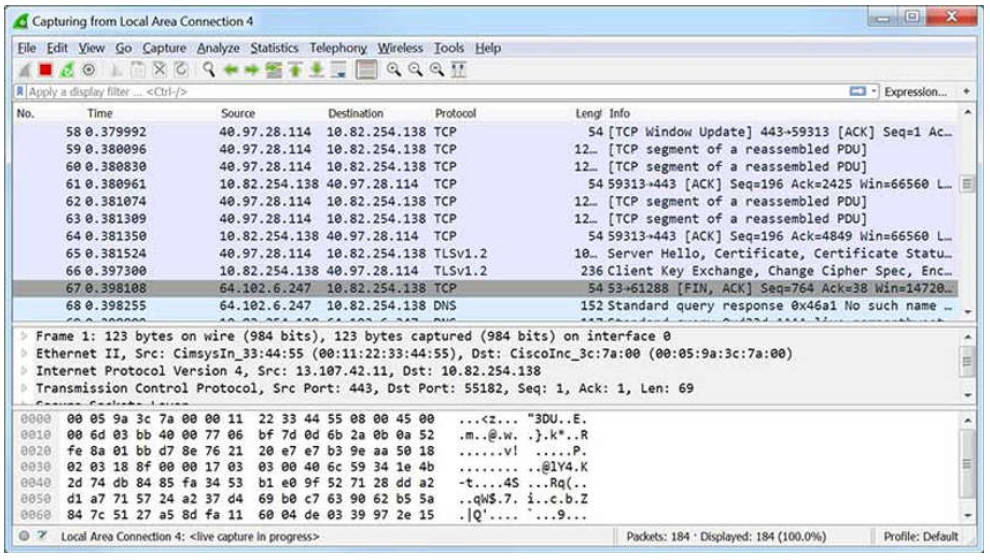
Frames that are captured by Wireshark are saved in a PCAP file. PCAP files contain the frame information, interface information, packet length, time stamps, and even entire binary files that are sent across the network.
Performing a long-term packet capture produces large PCAP files.
Wireshark can also open files that contain captured traffic from other software such as the tcpdump utility. Popular among UNIX-like systems such as Linux, tcpdump is a powerful utility with numerous command-line options. The example in the command output displays a sample tcpdump capture of ping packets.
[root@secOps analyst]# tcpdump -i hl-eth0 -n
tcpdump: verbose output suppressed, use -v or -vv for full protocol decode
listening on hl-eth0, link-type EN10MB (Ethernet), capture size 262144 bytes
10:42:19.841549 IP 10.0.0.12 > 10.0.0.11: ICMP echo request, id 2279, seq 5, length 64
10:42:19.841570 IP 10.0.0.11 > 10.0.0.12: ICMP echo reply, id 2279, seq 5, length 64
10:42:19.854287 IP 10.0.0.12 > 10.0.0.11: ICMP echo request, id 2279, seq 6, length 64
10:42:19.854304 IP 10.0.0.11 > 10.0.0.12: ICMP echo reply, id 2279, seq 6, length 64
10:42:19.867446 IP 10.0.0.12 > 10.0.0.11: ICMP echo request, id 2279, seq 7, length 64
10:42:19.867468 IP 10.0.0.11 > 10.0.0.12: ICMP echo reply, id 2279, seq 7, length 64
^C
6 packets captured
6 packets received by filter
0 packets dropped by kernel
[root@secOps analyst]#
Note: windump is a Microsoft Windows variant of tcpdump. tshark is a Wireshark command line tool that is similar to tcpdump.
15.2.3 NetFlow
NetFlow is a Cisco IOS technology that provides 24×7 statistics on packets that flow through a Cisco router or multilayer switch. NetFlow is the standard for collecting IP operational data in IP networks. NetFlow is now supported on non-Cisco platforms. IP Flow Information Export (IPFIX) is a version of NetFlow that is an IETF standard protocol.
NetFlow can be used for network and security monitoring, network planning, and traffic analysis. It provides a complete audit trail of basic information about every IP flow forwarded on a device. This information includes the source and destination device IP information, the time of the communication, and the amount of data transferred. NetFlow does not capture the actual content on the flow. NetFlow functionality is often compared to a telephone bill. The bill identifies the destination number, the time and duration of the call. However, it does not display the content of the telephone conversation.
Although NetFlow stores flow information in a local cache on the device, it should always be configured to forward data to a NetFlow collector which store the NetFlow data. There are a number of third-party tools for analysis of NetFlow data.
For example, in the figure, PC1 connects to PC2 using an application such as HTTPS.
NetFlow in the Network
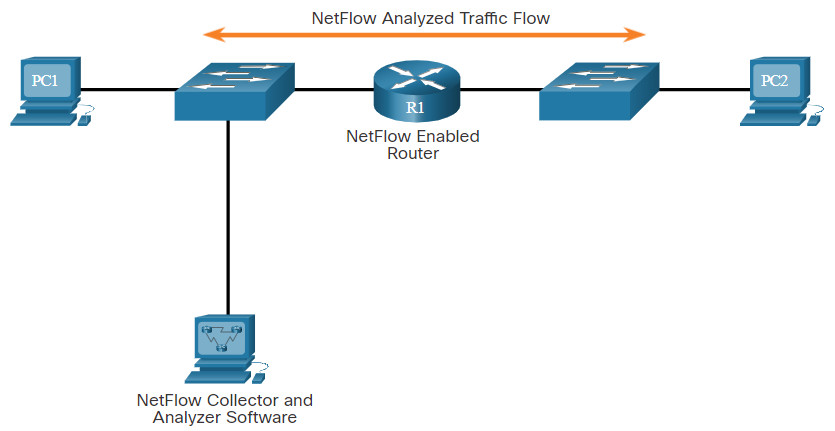
NetFlow can monitor that application connection by tracking byte and packet counts for that individual application flow. It then pushes the statistics over to an external server called a NetFlow collector.
For example, Cisco Stealthwatch collects NetFlow statistics to perform advanced functions including:
- Flow stitching – It groups individual entries into flows.
- Flow deduplication – It filters duplicate incoming entries from multiple NetFlow clients.
- NAT stitching – It simplifies flows with NAT entries.
There is a Cisco Stealthwatch channel on YouTube that provides many details about Stealthwatch and its uses.
15.2.4 SIEM and SOAR
Network security analysts must quickly and accurately assess the significance of any security event and answer the following critical questions:
- Who is associated with this event?
- Does the user have access to other sensitive resources?
- Does this event represent a potential compliance issue?
- Does the user have access to intellectual property or sensitive information?
- Is the user authorized to access that resource?
To help answer these questions, security analysists use:
- Security Information Event Management (SIEM)
- Security orchestration, automation, and response (SOAR)
15.2.5 SIEM Systems
Several SIEM systems exist. SolarWinds Security Event Manager and Splunk Enterprise Security are two of the more popular proprietary SIEM systems used by SOCs. Search the internet to learn more about these products.
In this course, we will use an open source product called Security Onion that includes the ELK suite for SIEM functionality. ELK is an acronym for three products from Elastic:
- Elasticsearch – Document oriented full text search engine
- Logstash – Pipeline processing system that connects “inputs” to “outputs” with optional “filters” in between
- Kibana – Browser based analytics and search dashboard for Elasticsearch
Search the internet to learn more about Elastic.co and its suite of products.
15.2.7 Packet Tracer – Logging Network Activity
In this activity, you will intercept credentials using a sniffer device, while observing an FTP session. An exchange of Syslog messages will also be intercepted by a sniffer device.
15.3 Network Monitoring and Tools Summary
15.3.1 What Did I Learn in this Module?
Network Security Topology
To mitigate threats, all networks must be secured and protected using a defense-in-depth approach. This requires using proven methods and a security infrastructure that consists of firewalls, intrusion detection systems (IDS), intrusion prevention systems (IPS), and endpoint security software. For large networks, an extra layer of protection must be added. A cybersecurity analyst needs to review all alerts that are generated by network devices and validate them. To determine normal network behavior, network monitoring must be implemented. Tools include IDS, packet analyzers, SNMP, NetFlow, and others. Two common methods that are used to capture traffic and send it to network monitoring devices are network taps (TAPs) and traffic mirroring using Switch Port Analyzer (SPAN) or other port mirroring. A network tap is typically a passive splitting device implemented inline between a device of interest and the network. A tap forwards all traffic, including physical layer errors, to an analysis device while also allowing the traffic to reach its intended destination. Network switches segment the network design. This limits the amount of traffic that is visible to network monitoring devices. Because of this, capturing data for network monitoring requires all traffic to bypass the network segmentation imposed by network switches. Port mirroring is a technique that allows this. The following are terms used by the SPAN feature: ingress traffic, egress traffic, source (SPAN) port, and destination (SPAN) port.
Introduction to Network Monitoring Tools
Common tools that are used for network security monitoring include network protocol analyzers (Wireshark and Tcpdump), NetFlow, and Security Information and Event Management Systems (SIEM). It is also common for security analysts to rely on log files and Simple Network Management Protocol (SNMP) for network behavior discovery. Network protocol analyzers (“packet sniffers”) are programs used to capture traffic. They show what is happening on the network, often through a graphic user interface. Analysts can use these applications to see network exchanges down to the packet level. Netflow is a Cisco IOS feature that provides 24×7 statistics on packets that flow through a Cisco router or multilayer switch. It can be used for network and security monitoring, network planning, and traffic analysis. SIEM is a technology that is used to provide real time reporting and long-term analysis of security events. SIEM include forensic analysis, and correlation, aggregation, and reporting functions. Several SEIM systems exist, including SolarWinds Security Manager and Splunk Enterprise Security. Security orchestration, automation, and response (SOAR) systems provide enhancements to SIEM.
