27.0 Introduction
27.0.1 Why Should I Take this Module?
There are many different types of data that are used in network security monitoring. Specialized tools are required to process, search, and investigate this data. In this module, you will learn about network security data and some of the tools that are used to investigate it.
27.0.2 What Will I Learn in this Module?
Module Title: Working with Network Security Data
Module Objective: Interpret data to determine the source of an alert.
| Topic Title | Topic Objective |
|---|---|
| A Common Data Platform | Explain how data is prepared for use in a Network Security Monitoring (NSM) system. |
| Investigating Network Data | Use Security Onion tools to investigate network security events.. |
| Enhancing the Work of the CyberSecurity Analyst | Describe network monitoring tools that enhance workflow management. |
27.1 A Common Data Platform
27.1.1 ELK
A typical network has a multitude of different logs to keep track of and most of those logs are in different formats. With huge amounts of disparate data, how is it possible to get an overview of network operations while also getting a sense of subtle anomalies or changes in the network?
The Elastic Stack attempts to solve this problem by providing a single interface view into a heterogenous network. The Elastic Stack consists of Elasticsearch, Logstash, and Kibana (ELK). It is a highly scalable and modular framework for ingesting, analyzing, storing and visualizing data. Elasticsearch is an open-core platform (open source in the core components) for searching and analyzing an organization’s data in near real time. It can be used in many different contexts but has gained popularity in network security as a SIEM tool. Security Onion includes ELK and other components from Elastic including:
- Beats – This is a series of software plugins that send different types of data to the Elasticsearch data stores.
- ElastAlert – This provides queries and security alerts based on user-defined criteria and other information from data in Elasticsearch. Alert notifications can be sent to a console, or email and other notification systems such as TheHive security incident response platform.
- Curator – This provides actions to manage Elasticsearch data indices.
Elasticsearch, which is the search engine component, uses RESTful web services and APIs, a distributed computing cluster with multiple server nodes, and a distributed NoSQL database made up of JSON documents. Additional functionality can be added through custom-created extensions. The Elasticsearch company offers a commercial extension called X-Pack which adds security, alerting, monitoring, reporting, and graphs. The company also offers a machine-learning add-on as well their own Elastic SIEM product.
Logstash enables the collection and normalization of network data into data indexes that can be efficiently searched by Elasticsearch. Logstash and Beats modules are used to ingest data into the Elasticsearch cluster.
Kibana provides a graphical interface to data that is compiled by Elasticsearch. It enables visualization of network data and provides tools and shortcuts for querying that data in order to isolate potential security breaches.
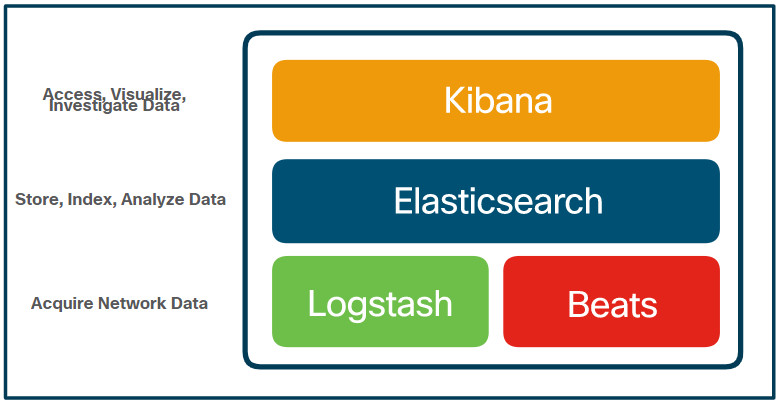
The core open source components of the Elastic Stack are Logstash, Beats, Elasticsearch, and Kibana, as shown in the figure.
Elastic Stack Core Components
Logstash
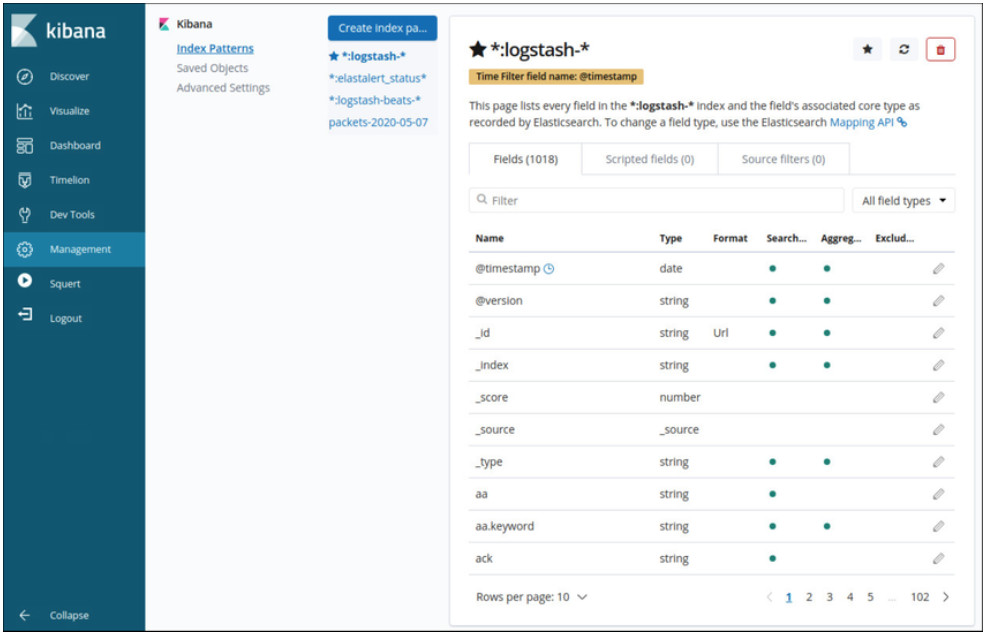
Logstash is an extract, transform and load system with the ability to take in various sources of log data and transform or parse the data through translation, sorting, aggregating, splitting, and validation. After transforming the data, the data is loaded into the Elasticsearch database in the proper file format. The figure shows some of the fields that are available in Logstash as shown in the Kibana Management interface.
Kibana Management Frame Showing Logstash Index Details
Beats
Beats agents are open source software clients used to send operational data directly into Elasticsearch or through Logstash. Elastic, as well as the open source community, actively develop Beats agents, so there are a huge variety of Beats agents for sending data to Elasticsearch in near real time. Some of the Beats agents provided by Elastic are Auditbeat for audit data, Metricbeat for metric data, Heartbeat for availability, Packetbeat for network traffic, Journalbeat for Systemd journals, and Winlogbeat for Windows event logs. Some community-sourced Beats are Amazonbeat, Apachebeat, Dockbeat, Nginxbeat, and Mqttbeat to name a few.
Elasticsearch
Elasticsearch is a cross platform enterprise search engine written in Java. The core components are open-source with commercial addons called X-packs that give additional functionality. Elasticsearch supports near real-time search using simple REST APIs to create or update JavaScript Object Notation (JSON) documents using HTTP requests. Searches can be made using any program capable of making HTTP requests such as a web browser, Postman, cURL, etc. These APIs can also be accessed by Python or other programming language scripts for automated operations.
The Elasticsearch data structure is called an inverted index, which is designed to allow very fast full-text searches. An index is like a database, it is a namespace for a collection of documents that are related to each other. An index can be partitioned or mapped into different types. If you compare an Elasticsearch index to a traditional relational database, the index is like the database, the types are like the tables, and the documents are like the columns and rows, as shown in the table.
| MySQL Component: | database | tables | columns/rows |
| Elasticsearch Component: | index | types | documents |
Elasticsearch stores data in JSON-formatted documents. A JSON document is organized into hierarchies of key/value pairs, with a key being a name and the corresponding value being either a string, number, Boolean, date, array, or other type of data.
Kibana
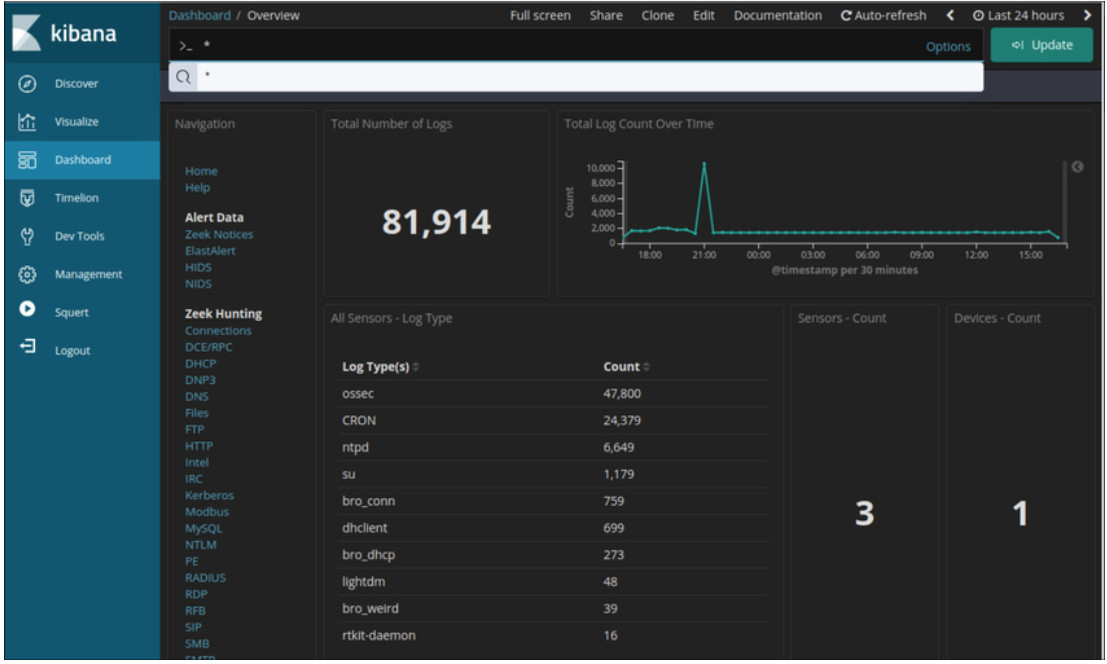
Kibana provides an easy to use graphical user interface for managing Elasticsearch. By using a web browser, an analyst can use the Kibana interface to search and view indices. The management tab allows you to create and manage indices and their types and formats. The discovery tab is a quick and powerful way to view your data and search it using the search tools. The visualize tab allows you to create custom visualizations like bar charts, line charts, pie charts, heat maps, and more. The visualizations you create can be organized into customized dashboards for monitoring and analyzing your data. A Kibana dashboard is shown in the figure.
A Kibana Dashboard
27.1.2 Data Reduction
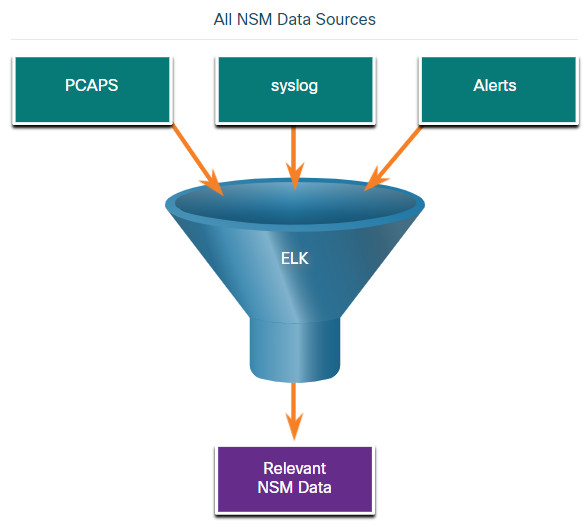
The amount of network traffic that is collected by packet captures and the number of log file entries and alerts that are generated by network and security devices can be enormous. Even with recent advances in Big Data, processing, storing, accessing, and archiving NSM-related data is a daunting task. For this reason, it is important to identify the network data that should be gathered. Not every log file entry, packet, and alert needs to be gathered. By limiting the volume of data, tools like Elasticsearch will be far more useful, as shown in the figure.
Some network traffic has little value to NSM. Encrypted data, such as IPsec or SSL traffic, is largely unreadable. Some traffic, such as that generated by routing protocols or spanning-tree protocol, is routine and can be excluded. Other broadcast and multicast protocols can usually be eliminated from packet captures, as can traffic from other protocols that generate a lot of routine traffic.
In addition, alerts that are generated by a HIDS, such as Windows security auditing or OSSEC, should be evaluated for relevance. Some are informational or of low potential security impact. These messages can be filtered from NSM data. Similarly, syslog may store messages of very low severity that could be disregarded to diminish the quantity of NSM data to be handled.
27.1.3 Data Normalization
Data normalization is the process of combining data from a number of data sources into a common format. Logstash provides a series of transformations that process security data and transform it before adding it to Elasticsearch. Additional plugins can be created to suit the needs of the organization.
A common schema will specify the names and formats for the required data fields. Formatting of the data fields can vary widely between sources. However, if searching is to be effective, the data fields must be consistent. For example, IPv6 addresses, MAC addresses, and date and time information can be represented in varying formats. Similarly, subnet masks, DNS records, and so on can vary in format between data sources. Logstash transformations accept the data in its native format and make elements of the data consistent across all sources. For example, a single format will be used for addresses and timestamps for data from all sources.
IPv6 Address Formats
- 2001:db8:acad:1111:2222::33
- 2001:DB8:ACAD:1111:2222::33
- 2001:DB8:ACAD:1111:2222:0:0:33
- 2001:DB8:ACAD:1111:2222:0000:0000:0033
MAC Formats
- A7:03:DB:7C:91:AA
- A7-03-DB-7C-91-AA
- A70.3DB.7C9.1AA
Date Formats
- Monday, July 24, 2017 7:39:35pm
- Mon, 24 Jul 2017 19:39:35 +0000
- 2017-07-24T19:39:35+00:00
- 1500925254
Data normalization is required to simplify searching for correlated events. If differently formatted values exist in the NSM data for IPv6 addresses, for example, a separate query term would need to be created for every variation in order for correlated events to be returned by the query.
27.1.4 Data Archiving
Everyone would love the security of collecting and saving everything, just in case. However, retaining NSM data indefinitely is not feasible due to storage and access issues. It should be noted that the retention period for certain types of network security information may be specified by compliance frameworks. For example, the Payment Card Industry Security Standards Council (PCI DSS) requires that an audit trail of user activities related to protected information be retained for one year.
Security Onion has different data retention periods for different types of NSM data. For pcaps and raw Bro logs, a value assigned in the securityonion.conf file controls the percentage of disk space that can be used by log files. By default, this value is set to 90%. For Elasticsearch, retention of data indices is controlled by Elasticsearch curator. Curator runs in a Docker container and executes every minute according to cron jobs. Curator logs its activity to curator.log. Curator defaults to closing indices older than 30 days. To modify this, change CURATOR_CLOSE_DAYS in /etc/nsm/securityonion.conf. As a disk reaches capacity, Curator deletes old indices to prevent your disk from filling up. To change the limit, modify LOG_SIZE_LIMIT in /etc/nsm/securityonion.conf.
Sguil alert data is retained for 30 days by default. This value is set in the securityonion.conf file.
Security Onion is known to require a lot of storage and RAM to run properly. Depending on the size of the network, multiple terabytes of storage may be required. Of course, Security Onion data can always be archived to external storage by a data archive system, depending on the needs and capabilities of the organization.
Note: The storage locations for the different types of Security Onion data will vary based on the Security Onion implementation.
27.1.5 Lab – Convert Data into a Universal Format
Log entries are generated by network devices, operating systems, applications, and various types of programmable devices. A file containing a time-sequenced stream of log entries is called a log file. By nature, log files record events that are relevant to the source. The syntax and format of data within log messages are often defined by the application developer. Therefore, the terminology used in the log entries often varies from source to source. For example, depending on the source, the terms login, logon, authentication event, and user connection, may all appear in log entries to describe a successful user authentication to a server.
It is desirable to have a consistent and uniform terminology in logs generated by different sources. This is especially true when all log files are being collected by a centralized point. The term normalization refers to the process of converting parts of a message, in this case a log entry, to a common format.
In this lab, you will use command line tools to manually normalize log entries. In Part 2, the timestamp field must be normalized. In Part 3, the IPv6 field requires normalization.
27.1.5 Lab – Convert Data into a Universal Format
27.2 Investigating Network Data
27.2.1 Working in Sguil
The primary duty of a cybersecurity analyst is the verification of security alerts. Depending on the organization, the tools used to do this will vary. For example, a ticketing system may be used to manage task assignment and documentation. In Security Onion, the first place that a cybersecurity analyst will go to verify alerts is Sguil.
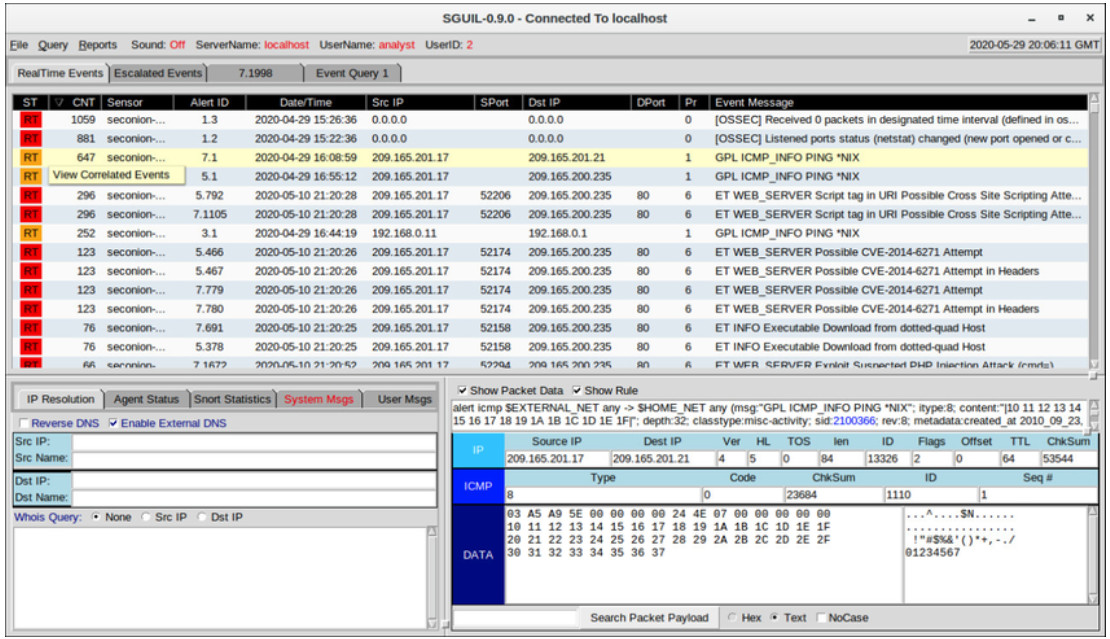
Sguil automatically correlates similar alerts into a single line and provides a way to view correlated events represented by that line. In order to get a sense of what has been happening in the network, it may be useful to sort on the CNT column to display the alerts with the highest frequency.
Right-clicking the CNT value and selecting View Correlated Events opens a tab that displays all events that are related by Sguil. This can help the cybersecurity analyst understand the time frame during which the correlated events were received by Sguil. Note that each event receives a unique event ID. Only the first event ID in the series of correlated events is displayed in the RealTime Events tab. The figure shows Sguil alerts sorted on CNT with the View Correlated Events menu open.
Sguil Alerts Sorted on CNT
27.2.2 Sguil Queries
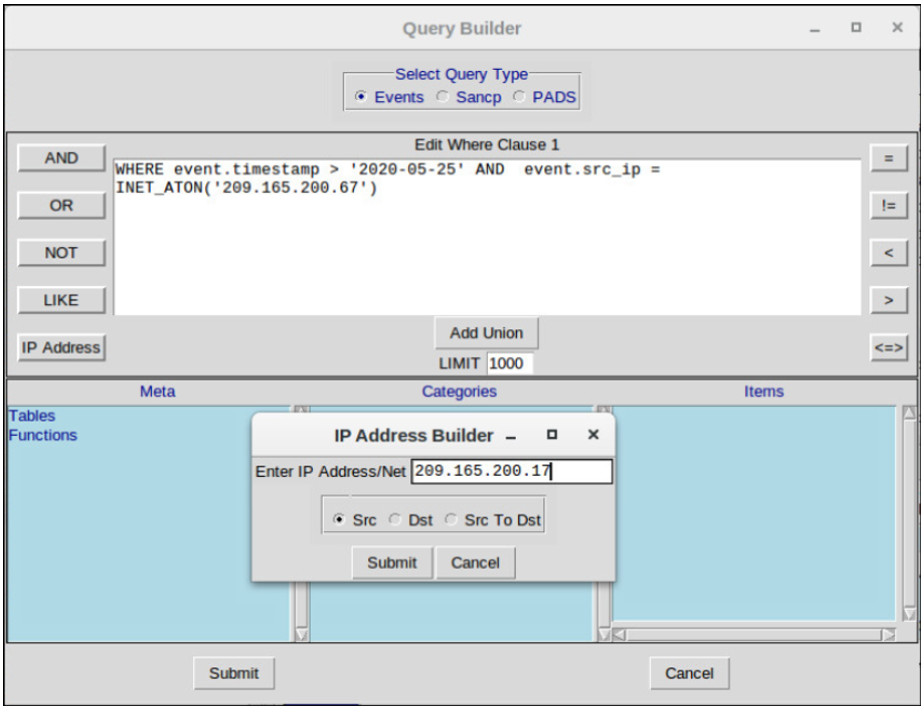
Queries can be constructed in Sguil using the Query Builder. It simplifies constructing queries to a certain degree, but the cybersecurity analyst must know the field names and some issues with field values. For example, Sguil stores IP addresses in an integer representation. In order to query on an IP address in dotted decimal notation, the IP address value must be placed within the INET_ATON() function. Query Builder is opened from the Sguil Query menu. Select Query Event Table to search active events.
The table shows the names of some of the event table fields that can be queried directly. Selecting Show DataBase Tables from the Query menu displays a reference to the field names and types for each of the tables that can be queried. When conducting event table searches, use the pattern event.fieldName = value.
| Field Name | Type | Description |
|---|---|---|
| sid | int | the unique ID of the sensor |
| cid | int | the sensor’s unique event number |
| signature | varchar | the human-readable name of the event (e.g. “WEB-IIS view source via translate header”) |
| timestamp | datetime | the date and time the event occurred on the sensor |
| status | int | the Sguil classification assigned to this event. Unclassified events are priority 0. |
| src_ip | int | the source IP for the event. Use the INET_ATON() function to covert the address to the database’s integer representation. |
| dst_ip | int | the destination IP for the event |
| src_port | int | the source port of the packet that triggered the event |
| dst_port | int | the destination port of the packet that triggered the event |
| ip_proto | ing | IP protocol type of the packet. (6 = TCP, 17 = UDP, 1 = ICMP, others are possible) |
The figure shows a simple timestamp and IP address query made in the Query Builder window. Note the use of the INET_ATON() function to simplify entering an IP address.
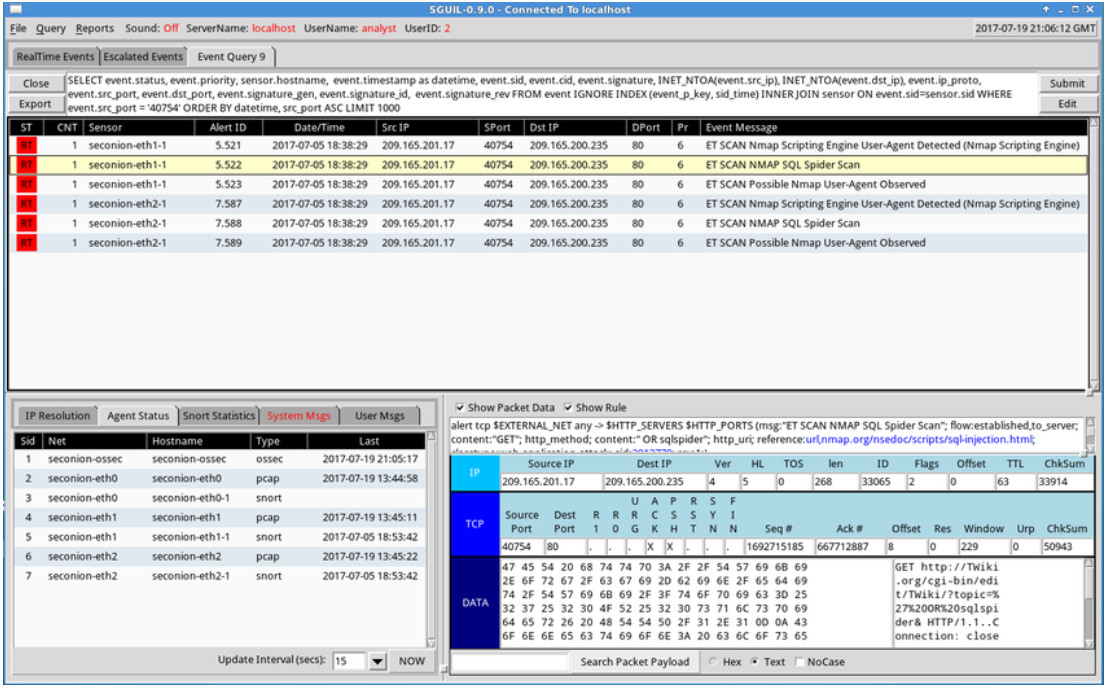
In the example below, the cybersecurity analyst is investigating a source port 40754 that is associated with an Emerging Threats alert. Towards the end of the query, the WHERE event.src_port = ‘40754’ portion was created by the user in Query Builder. The remainder of the query is supplied automatically by Sguil and concerns how the data that is associated with the events is to be retrieved, displayed, and presented.
27.2.3 Pivoting from Sguil
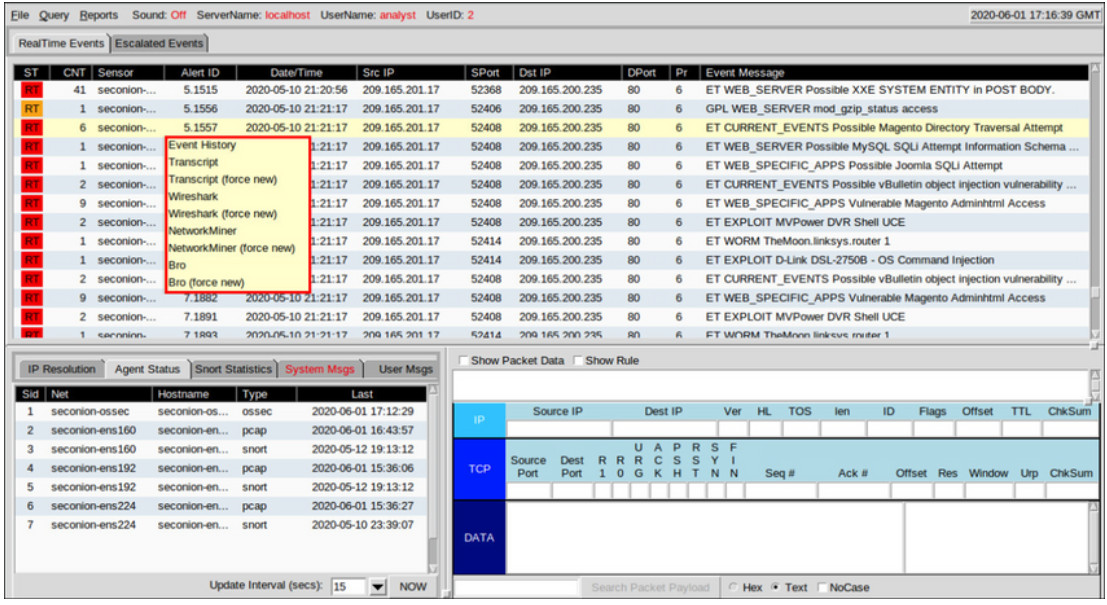
Sguil provides the ability for the cybersecurity analyst to pivot to other information sources and tools. Log files are available in Elasticsearch. Relevant packet captures can be displayed in Wireshark. Transcripts of TCP sessions and Zeek (Bro) detection information are also available. The menu shown in the figure was opened by right-clicking on an Alert ID. Selecting from this menu will open information about the alert in other tools, which provides rich, contextualized information to the cybersecurity analyst.
Pivoting from Sguil
Additionally, Sguil can provide pivots to Passive Real-time Asset Detection System (PRADS) and Security Analyst Network Connection Profiler (SANCP) information. These tools are accessed by right-clicking on an IP address for an event and selecting the Quick Query or Advanced Query menus.
PRADS gathers network profiling data, including information about the behavior of assets on the network. PRADS is an event source, like Snort and OSSEC. It can also be queried through Sguil when an alert indicates that an internal host may have been compromised. Executing a PRADS query out of Sguil can provide information about the services, applications, and payloads that may be relevant to the alert. In addition, PRADS detects when new assets appear on the network.
Note: The Sguil interface refers to PADS instead of PRADS. PADS was the predecessor to PRADS. PRADS is the tool that is actually used in Security Onion. PRADS is also used to populate SANCP tables. In Security Onion, the functionalities of SANCP have been replaced by PRADS, however the term SANCP is still used in the Sguil interface. PRADS collects the data, and a SANCP agent records the data in a SANCP data table.
The SANCP functionalities concern collecting and recording statistical information about network traffic and behavior. SANCP provides a means of verifying that network connections are valid. This is done through the application of rules that indicate which traffic should be recorded and the information with which the traffic should be tagged.
27.2.4 Event Handling in Sguil
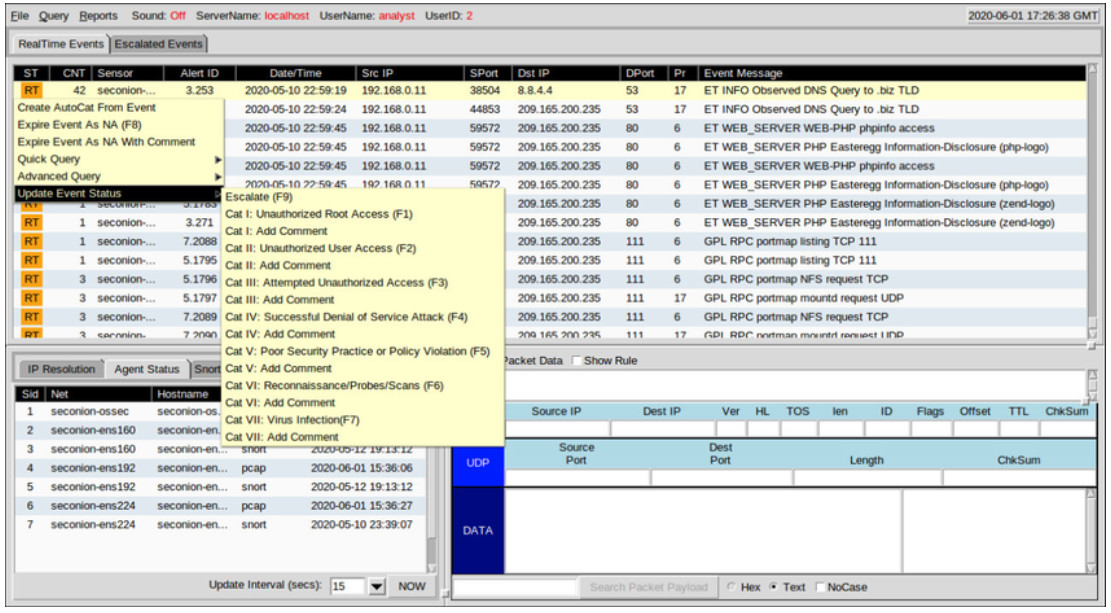
Finally, Sguil is not only a console that facilitates investigation of alerts. It is also a tool for addressing or classifying alerts. Three tasks can be completed in Sguil to manage alerts. First, alerts that have been found to be false positives can be expired. This can be done by using the right-clicking in the ST column for the event an using the menu or by pressing the F8 key. An expired event disappears from the queue. Second, if the cybersecurity analyst is uncertain how to handle an event, it can be escalated by pressing the F9 key. The alert will be moved to the Sguil Escalated Events tab. Finally, an event can be categorized. Categorization is for events that have been identified as true positives.
Sguil includes seven pre-built categories that can be assigned by using a menu, which is shown in the figure, or by pressing the corresponding function key. For example, an event would be categorized as Cat I by pressing the F1 key. In addition, criteria can be created that will automatically categorize an event. Categorized events are assumed to have been handled by the cybersecurity analyst. When an event is categorized, it is removed from the list of RealTime Events. The event remains in the database however, and it can be accessed by queries that are issued by category.
This course covers Sguil at a basic level. Numerous resources exist on the internet for learning more.
Event Handling in Sguil
27.2.5 Working in ELK
Logstash and Beats are used for data ingestion in the Elastic Stack. They provide access to large numbers of log file entries. Because the number of logs that can be displayed is so large, Kibana, which is the visual interface into the logs, is configured to show the last 24 hours by default. You can adjust the time range to view broader or older ranges of data.
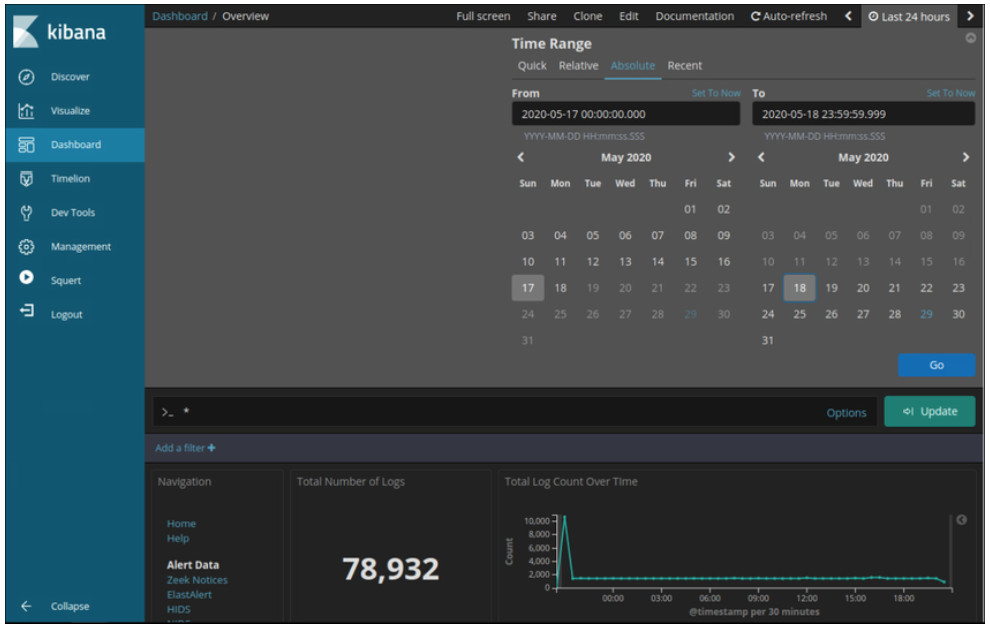
In order to see log file records for a different period of time, click the Last 24 hours tab in the upper right corner of Kibana. From there, set the Time Range by selecting the Quick tab for predefined time ranges. You can also enter the dates and times manually using the Absolute tab. The figure shows an Absolute time range from May 17th to May 18th, 2020. Logs are ingested into Elasticsearch into separate indices or databases based on a configured range of time.
The best way to monitor your data in Elasticsearch is to build customized visual dashboards that track the data that you are interested in using. A variety of visual charts including bar graphs, pie charts, count metrics, heat maps, Geo maps, top number lists are available. In Kibana, visualizations and charts can be searched and filtered with specific metrics and buckets of data.
27.2.6 Queries in ELK
Elasticsearch is built on Apache Lucene, an open-source search engine software library that features full text indexing and searching capabilities. Elasticsearch ingests data into documents called indices and those documents are mapped to various datatypes using index patterns. The index patterns create a data structure of JSON-formatted fields and values. The datatypes in the fields can be in the following formats:
- Core Datatypes: Text (Strings), Numeric, Date, Boolean, Binary, and Range
- Complex Datatypes: Object (JSON), Nested (arrays of JSON objects)
- Geo Datatypes: Geo-point (latitude/longitude), Geo-shape (polygons)
- Specialized Datatypes: IP addresses, Token count, Histogram, etc.)
Using Lucene software libraries, Elasticsearch has its own query language based on JSON called Query DSL (Domain Specific Language). Query DSL features leaf queries, compound queries, and expensive queries. Leaf queries look for a specific value in a specific field, such as the match, term, or range queries. Compound queries enclose other leaf or compound queries and are used to combine multiple queries in a logical fashion. Expensive queries execute slowly and include fuzzy matching, regex matching, and wildcard matching.
Query Language
Along with JSON, Elasticsearch queries make use of the following elements: Boolean operators, Fields, Ranges, Wildcards, Regex, Fuzzy search, Text search.
- Boolean Operators – AND, OR, and NOT operators:
- “php” OR “zip” OR “exe” OR “jar” OR “run”
- “RST” AND “ACK”
- Fields – In colon separated key:value pairs you specify the key field, a colon, a space and the value:
- dst.ip: “192.168.1.5”
- dst.port: 80
- Ranges – You can search for fields within a specific range using square brackets (inclusive) or curly braces (exclusive) range:
- host:[1 TO 255] — Will return events with age between 1 and 255
- TTL:{100 TO 400} — Will return events with prices between 101 and 399
- name: [Admin TO User] — Will return names between and including Admin and User
- Wildcards – The * character is for multiple character wildcards and the ? character for single character wildcards:
- P?ssw?rd — Will match Password, and P@ssw0rd
- Pas* — Will match Pass, Passwd, and Password
- Regex – These are placed between forward slashes (/):
- /d[ao]n/ — Will match both dan and don
- /<.+>/ — Will match text that resembles an HTML tag
- Fuzzy Search – Fuzzy searching uses the Damerau-Levenshtein Distance to match terms that are similar in spelling. This is great when your data set has misspelled words. Use the tilde (~) to find similar terms:
- index.php~ – This may return results like “index.html,” “home.php”, and “info.php.”
- Use the tilde (~) along with a number to specify the how big the distance between words can be:
- term~2 – This will match, among other things: “team,” “terms,” “trem,” and “torn”
- Text search – Type in the term or value you want to find. This can be a field, or a string within a field, etc.
Query Execution
Elasticsearch was designed to interface with users using web-based clients that follow the HTTP REST framework. Queries can be executed using the following methods:
- URI – Elasticsearch can execute queries using URI searches:
- http://localhost:9200/_search?q=query:ns.example.com
- cURL – Elasticsearch can execute queries using cURL from the command line:
- curl “localhost:9200/_search?q=query:ns.example.com”
- JSON – Elasticsearch can execute queries with a request body search using a JSON document beginning with a query element, and a query formatted using the Query Domain Specific Language.
- Dev Tools – Elasticsearch can execute queries using the Dev Tools console in Kibana and a query formatted using the Query Domain Specific Language.
Note: Advanced Elasticsearch queries are beyond the scope of this course. In the labs, you will be provided with the complex query statements, if necessary.
27.2.7 Investigating Process or API Calls
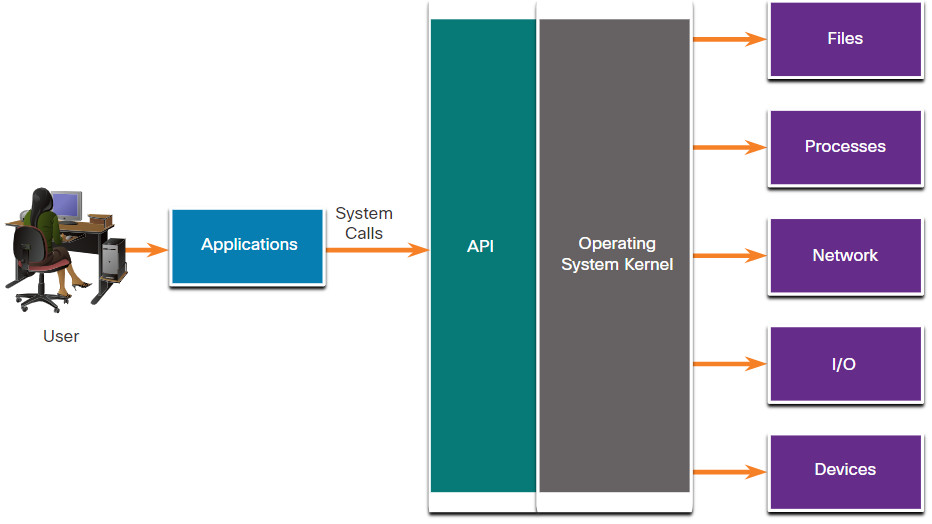
Applications interact with an operating system (OS) through system calls to the OS application programming interface (API), as shown in the figure. These system calls allow access to many aspects of system operation such as:
- Software process control
- File management
- Device management
- Information management
- Communication
Malware can also make system calls. If malware can fool an OS kernel into allowing it to make system calls, many exploits are possible.
HIDS software tracks the operation of a host OS. OSSEC rules detect changes in host-based parameters like the execution of software processes, changes in user privileges, and registry modifications, among many others. OSSEC rules will trigger an alert in Sguil. Pivoting to Kibana on the host IP address allows you to choose the type of alert based on the program that created it. Filtering for OSSEC indices results in a view of the OSSEC events that occurred on the host, including indicators that malware may have interacted with the OS kernel.
27.2.8 Investigating File Details
In Sguil, if the cybersecurity analyst is suspicious of a file, the hash value can be submitted to an online site, such as VirusTotal, to determine if the file is known malware. The hash value can be submitted from the Search tab on the VirusTotal page.
In Kibana, Zeek Hunting can be used to display information regarding the files that have entered the network. From the MIME, or media, types that are present, filters can be set to display information about specific types of files such as application/xml or application/zip. From there, details for the individual files can be displayed, as shown in the figure. Note that in Kibana, the event type is shown as bro_files, even though the new name for Bro is Zeek.
File Details from Zeek as Displayed in Kibana
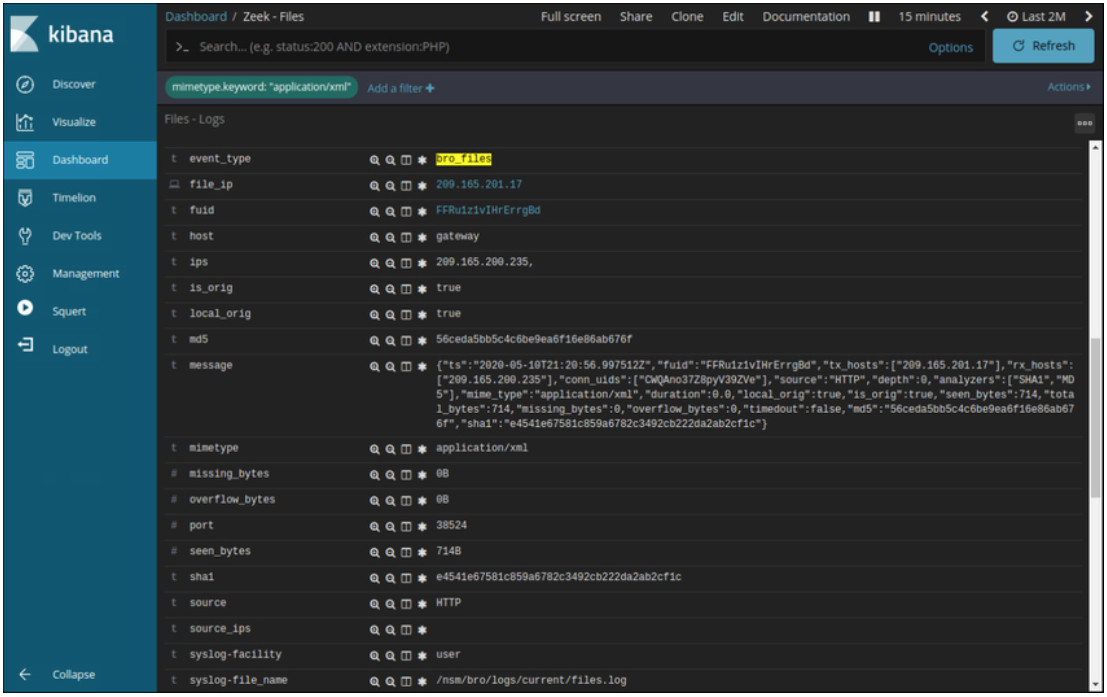
Numerous details are available for the files. In this example, the MD5 and SHA-1 hashes are shown, as are other details. Blue entries provide pivots to view details of the information provided in the table in capME! or other tools.
27.2.9 Lab – Regular Expression Tutorial
A regular expression (regex) is a pattern of symbols that describes data to be matched in a query or other operation. Regular expressions are constructed similarly to arithmetic expressions, by using various operators to combine smaller expressions. There are two major standards of regular expression, POSIX and Perl.
In this lab, you will use an online tutorial to explore regular expressions. You will also describe the information that matches given regular expressions.
27.2.9 Lab – Regular Expression Tutorial
27.2.10 Lab – Extract an Executable from a PCAP
Looking at logs is very important, but it is also important to understand how network transactions happen at the packet level.
In this lab, you will analyze the traffic in a previously captured pcap file and extract an executable file from the traffic.
27.2.10 Lab – Extract an Executable from a PCAP
27.2.11 Video – Interpret HTTP and DNS Data to Isolate Threat Actor
Watch the video to view a walkthrough of the Security Onion Interpret HTTP and DNS Data to Isolate Threat Actor lab.
27.2.12 Lab – Interpret HTTP and DNS Data to Isolate Threat Actor
In this lab, you will investigate SQL injection and DNS exfiltration exploits using Security Onion tools.
27.2.12 Lab – Interpret HTTP and DNS Data to Isolate Threat Actor
27.2.13 Video – Isolate Compromised Host Using 5-Tuple
Watch the video to view a walkthrough of the Security Onion Isolate Compromised Host Using 5-Tuple lab.
27.2.14 Lab – Isolate Compromised Host Using 5-Tuple
In this lab, you will use Security Onion tools to investigate an exploit using Security Onion tools.
27.2.14 Lab – Isolate Compromised Host Using 5-Tuple
27.2.15 Lab – Investigate a Malware Exploit
In this lab you will use Security Onion to investigate a more complex malware exploit the uses an exploit kit to infect hosts.
27.2.15 Lab – Investigating a Malware Exploit
27.2.16 Lab – Investigating an Attack on a Windows Host
In this lab you will:
- Investigate an attack on a Windows host.
- Use Sguil, Kibana, and Wireshark in Security Onion to investigate the attack.
- Examine exploit artifacts.
27.2.16 Lab – Investigating an Attack on a Windows Host
27.3 Enhancing the Work of the Cybersecurity Analyst
27.3.1 Dashboards and Visualizations
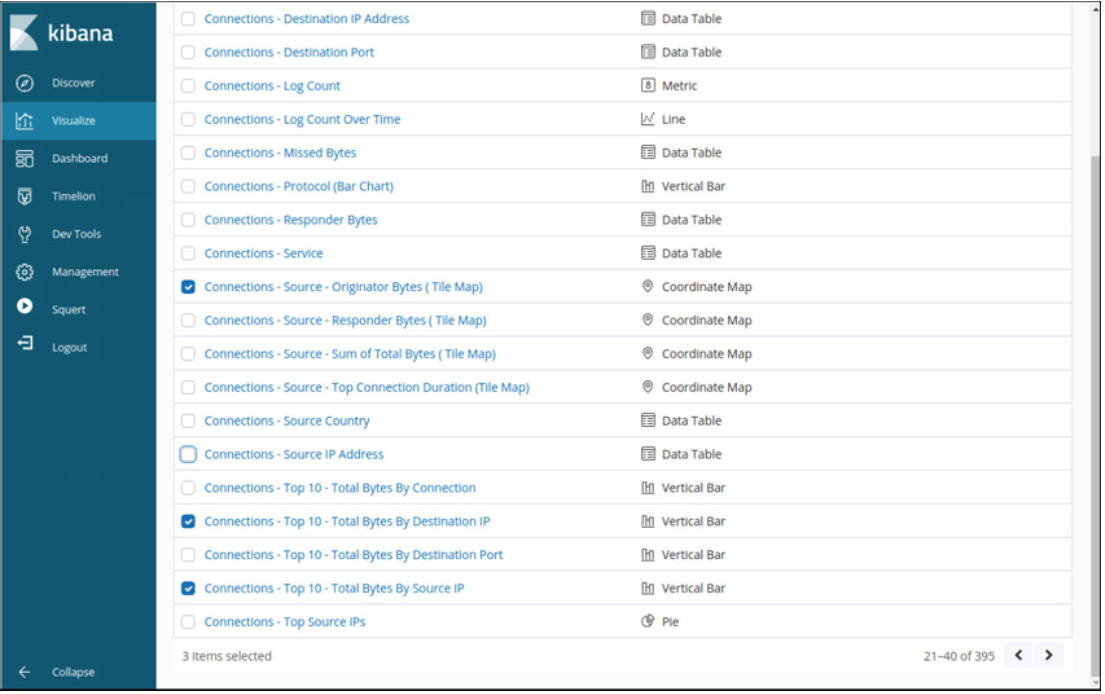
Dashboards provide a combination of data and visualizations that are designed to improve access to and interpretation of large amounts of information. Dashboards are usually interactive. They allow cybersecurity analysts to focus on specific details and information by clicking on elements of the dashboard. For example, clicking on a bar in a bar chart could provide a breakdown of the information for the data represented by that bar. Kibana includes the capability of designing custom dashboards. In addition, other tools that are included in Security Onion, such as Squert, provide a visual interface to NSM data.
The Kibana interface for selecting the visualizations that will compose a custom dashboard are shown in the figure.
Selecting Visualizations for a Custom Kibana Dashboard
27.3.2 Workflow Management
Because of the critical nature of network security monitoring, it is essential that workflows are managed. Workflows are the sequence of processes and procedures through which work tasks are completed. Managing SOC workflows enhances the efficiency of the cyberoperations team, increases the accountability of staff, and ensures that all potential alerts are treated properly. In large security organizations, it is conceivable that thousands of alerts will be received daily. Each alert should be systematically assigned, processed, and documented by cyberoperations staff.
Runbook automation, or workflow management systems, provide the tools necessary to streamline and control processes in a cybersecurity operations center. Sguil provides basic workflow management. However, it is not a good choice for large operations with many employees. Instead, third party workflow management systems are available that can be customized to suit the needs of cybersecurity operations.
In addition, automated queries are useful for adding efficiency to the cyberoperations workflow. These queries, sometimes known as plays, or playbooks, automatically search for complex security incidents that may evade other tools. In Kibana, filtered searches can be turned into visualizations, which can be dynamically updated and monitored to track events. The ELK stack can add alerting functionality by installing the X-Pack extension into Elastic. X-Pack is a commercial extension to Elasticsearch and bundles security, alerting, monitoring, reporting, and graph capabilities. Elasticsearch provides multiple forms of alert notification and can notify cybersecurity analysts by email or other means. In addition to X-Pack, Elastic.co also offers their own commercial Elastic SIEM product with advanced monitoring, alerting, and orchestration capabilities.
27.4 Working with Network Security Data Summary
27.4.1 What Did I Learn in this Module?
A Common Data Platform
Because of the diversity of network monitoring data, a network security monitoring platform must unite the data for analysis. ELK, or The Elastic Stack, is such a platform. ELK consists of Elasticsearch, Logstash, and Kibana with Beats, ElastAlert, and Curator. These components enable the collection, normalization, and analysis of network monitoring data. Elasticsearch allows fast searching of large amounts of data. Logstash and Beats modules compile and normalize data from many sources, and Kibana provides a graphical user interface and tools for analyzing the data. Network data must be reduced so that only relevant data is processed by the NSM system. Network data must also be normalized to convert the same types of data to consistent formats. Data must be archived for a reasonable amount of time and that period may be specified by compliance frameworks. Security Onion is configured to delete data automatically if available disk space becomes too low. Curator will delete Logstash indices that are older than 30 days by default.
Investigating Network Data
Sguil provides a console that enables a cybersecurity analyst to investigate, verify, and classify security alerts. Sguil correlates events based on information such as source and destination IP addresses and Layer 4 ports, among others. This unclutters the analyst console by representing related events on a single line. The CNT column indicates the number of events that have been correlated for an alert. The first alert in the series is shown. The entire series can be viewed in Sguil by right-clicking the CNT value and choosing View Correlated Events. Pivoting involving moving from information in one application to different tools that are specialized for viewing details of that information. Sguil provides ways to handle alerts by escalating, retiring, and classifying them.
Kibana only displays data for the last 24 hours by default. This is to keep the display from becoming cluttered. When investigating data that occurred prior to that period, the time range must be set by the analyst. Custom dashboards with a variety of visualizations can be created. There are several way to query Elasticsearch using Query DSL (Domain Specific Language). Numerous operators, fields, wildcards and other terms can be specified. Queries can be executed by sending them directly to a RESTful URI or through cURL, JSON query bodies. or by using Kibana Dev Tools. Process and API calls can be investigated by working with OSSEC HIDS alerts. In addition, file details, such as file types and hashes can be accessed through Kibana and can be submitted to an external source to be identified as benign or as malware. One such source is VirusTotal.
Enhancing the Work of the Cybersecurity Analyst
Kibana visualizations provide insights into NSM data by representing large amounts of data formats that are easier to interpret. Some dashboards provide the ability to click on interactive elements that will provide focused information. Workflow management adds efficiency to the work of the SOC team. Runbook automation, or workflow management systems, provide tools to streamline and control SOC processes. Automated queries also help to add efficiency. These queries, known as plays or playbooks, automatically search for complex security incidents that may evade other tools.
