24.2.2 Packet Tracer – Logging from Multiple Sources (Answers)
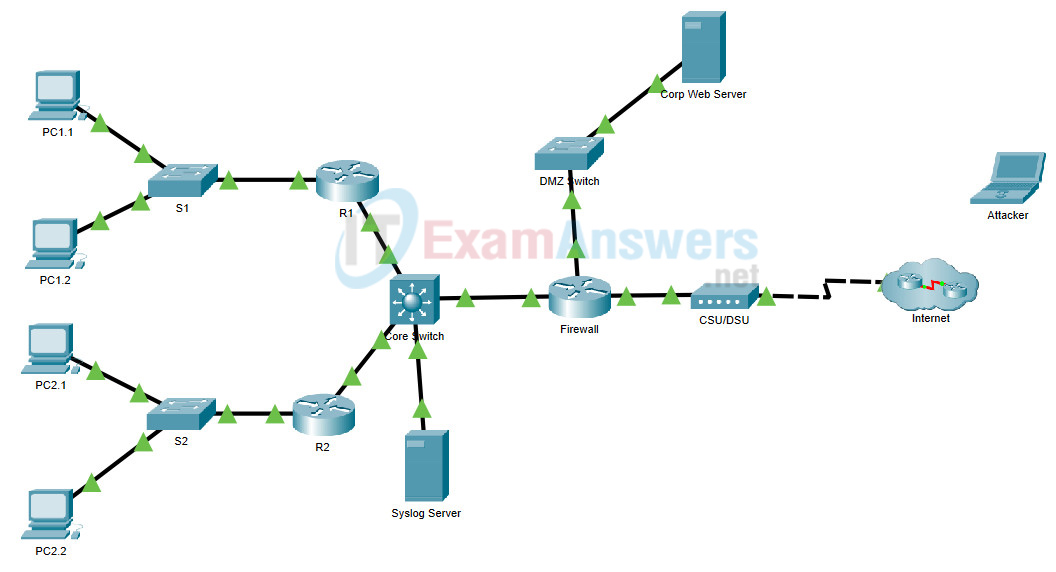
Topology

24.2.2 Packet Tracer – Logging from Multiple Sources
Objectives
- Part 1: Use syslog to capture log files from multiple network devices
- Part 2: Observe AAA user access logging
- Part 3: Observe NetFlow information
Background / Scenario
In this activity, you will use Packet Tracer to view network data generated by syslog, AAA, and NetFlow.
Instructions
Part 1: View Log Entries with Syslog
Step 1: The syslog Server
Packet Tracer supports basic syslog operations. The IOS devices in the topology are configured to send their log entries to the Syslog Server. The Syslog Server collects the log entries and allows them to be read.
Log entries are categorized by seven severity levels. Lower levels represent more serious events. The levels are: emergencies (0), alerts (1), critical (2), errors (3), warnings (4), notifications (5), informational (6), and debugging (7). Syslog clients can be configured to send log entries to syslog servers based on the severity level.
a. Click the Syslog Server to open its window.
b. Select the Services tab and select SYSLOG from the list of services shown on the left.
c. Click On to turn on the Syslog service.
d. Keep this window open and visible.
Step 2: Enable Syslog.
The devices are already configured to send log messages to the syslog server, but Packet Tracer only supports logging for the debugging severity level with syslog. Because of that, we must generate debug level messages (level 7) so they can be sent to the syslog server.
a. Click R1 > CLI
b. Enter the command debug eigrp packets to enable EIGRP debugging. The command line console will immediately fill with debug messages.
c. Return to the Syslog Server Verify that log entries appear there.
d. After a few messages have been logged, click the radio button to turn the syslog service Off.
What information is included in the syslog messages that are displayed on the Syslog Server?
Example message:
EIGRP: Sending HELLO on GigabitEthernet0/0 AS 1, Flags 0x0, Seq 10/0 idbQ 0/0 iidbQ un/rely 0/0
Some of the information is the type of EIGRP packet (HELLO), the interface that received the packet, the EIGRP autonomous system number, timestamp for the message and the source of the message. Details will vary.
Part 2: Log User Access
Another important type of log relates to user access. Having records of user logins is crucial for troubleshooting and traffic analysis. Cisco IOS supports Authentication, Authorization and Accounting (AAA). With AAA, it is possible not only to delegate the user validation task to an external server but also to log activities.
TACACS+ is a protocol designed to allow remote authentication through a centralized server.
Packet Tracer offers basic AAA and TACACS+ support. When someone attempts to log on to R2, R2 will ask the TACACS+ server if that user is valid by verifying username and password. The server not only stores user credentials, it also logs user login transactions. Follow the steps below to log in to R2 and display the log entries related to that login:
a. Click the Syslog Server to open its window.
b. Select the Desktop tab and select AAA Accounting. Leave this window open.
c. Click R2 > CLI.
d. Enter the following user credentials: admin and ccnp_8 as the username and password.
e. Return to the Syslog Server’s AAA Accounting Records window.
What information is in the log entry?
The log entry will resemble:
DATE= 09:56:31 UTC Apr 05 2017 ,Username= admin ,Caller Id= ,Flag= Start ,NAS IP= 192.168.12.2 ,NAS Port= con0
The entry contains the timestamp for when the event occurred, the username and password used, R2’s IP address (the device used for the login attempt) and a Start flag. The Start flag indicates that the analyst user logged in at the time shown.
f. On R2, enter the logout command.
What happened in the AAA Accounting window?
A new entry was added, however this time the Stop flag indicates that the user logged out.
Part 3: NetFlow and Visualization
In the topology, the Syslog Server is also a NetFlow collector. The Firewall router is configured as a NetFlow exporter.
a. Click the Syslog Server and close the AAA Accounting Records window.
b. From the Desktop tab, select Netflow Collector. Be sure that the NetFlow collector service is turned on.
c. From any PC, ping the Corp Web Server at 209.165.200.194. After a brief delay, the pie chart will update to show the new traffic flow.
d. Click the segments of the pie chart to view information about each flow.
What information is included provided by NetFlow?
The flow information includes the percentage of traffic that the flow represents, the source and destination addresses, IP protocol information, TCP flags, timestamps, and other information.
Note: The pie charts displayed will vary based on the traffic on the network. Other packet flows, such as EIGRP-related traffic, are present between devices. NetFlow is capturing these packets and exporting statistics to the NetFlow Collector. The longer NetFlow runs on a network, the more traffic statistics will be captured.
