4.6.1 Packet Tracer – Skills Integration Challenge-Analyzing the Application and Transport Layers Answers
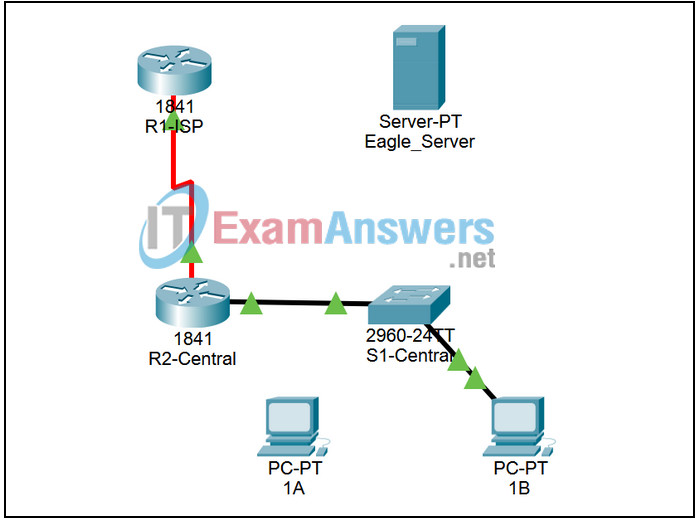
Topology Diagram:
Partial topology given; must be completed.

| Device | Interface | IP Address | Subnet Mask | Default Gateway |
|---|---|---|---|---|
| R1-ISP | Fa0/0 | 192.168.254.253 | 255.255.255.0 | N/A |
| S0/0/0 | 10.10.10.6 | 255.255.255.252 | ||
| R2-Central | Fa0/0 | 172.16.255.254 | 255.255.0.0 | N/A |
| S0/0/0 | 10.10.10.5 | 255.255.255.252 | ||
| S1-Central | VLAN 1 | 172.16.254.1 | 255.255.0.0 | 172.16.255.254 |
| PC 1A | NIC | 172.16.1.1 | 255.255.0.0 | 172.16.255.254 |
| PC 1B | NIC | 172.16.1.2 | 255.255.0.0 | 172.16.255.254 |
| Eagle Server | NIC | 192.168.254.254 | 255.255.255.0 | 192.168.254.253 |
Learning Objectives:
- Configure Hosts and Services
- Connect and configure hosts and services on the model of the lab network
- Explore How DNS, UDP, HTTP, and UDP Work Together
- Use simulation mode to visualize the operation of DNS, UDP, HTTP, and TCP on the model of the lab network
Background:
Throughout the course, you will be using a standard lab setup created from actual PCs, servers, routers, and switches to learn networking concepts. At the end of each chapter, you will build increasingly larger parts of this topology in Packet Tracer, and analyze increasingly more complex protocol interactions.
Task 1: Repair and Test The Topology
The server has been replaced. Configure it with the following settings: IP Address 192.168.254.254, Subnet Mask 255.255.255.0, Default Gateway 192.168.254.253, DNS enabled, with the association of “eagle-server.example.com” (without the quotes) with the server’s IP address, HTTP enabled. Connect the Eagle Server to the Fa0/0 port on the R1-ISP router.
PC 1A has lost its IP address information. Configure it with the following settings: IP Address 172.16.1.1, Subnet Mask 255.255.0.0, Default Gateway 172.16.255.254, and DNS Server 192.168.254.254. Connect PC 1A to the Fa0/1 port of the S1-Central switch.
Verify your work using feedback from the Check Results button and the Assessment Items tab. Test connectivity, in realtime, by using ADD SIMPLE PDU to test connectivity between PC 1A and the Eagle Server.
Note that when you add a simple PDU, it appears in the PDU List Window as part of “Scenario 0”. The first time you issue this one-shot ping message, it will show as Failed–this is because of the ARP process which will be explained later. Double clicking the “Fire” button in the PDU List Window, send this single test ping a second time. This time it will be successful. In Packet Tracer, the term “scenario” means a specific configuration of one or more test packets. You can create different test packet scenarios by using the New button–for example Scenario 0 might have one test packet from PC 1A to Eagle Server; Scenario 1 might test packets between PC 1B and the routers… You can remove all test packets in a particular scenario by using the Delete button. For example, if you use the Delete button for Scenario 0 the test packet you just created between PC 1A and Eagle Server will be removed–please do this prior to the next task.
Task 2: Explore How DNS, UDP, HTTP, and TCP Work Together
Switch from Realtime to Simulation Mode. Make sure Event Filter is set to display DNS, UDP, HTTP, TCP, and ICMP. Open a web browser from the desktop of 1A. Type in the URL eagle-server.example.com, press Enter, and then use the Capture / Forward button in the Event List to capture the interaction of DNS, UDP, HTTP and TCP.
You can examine the packet in two ways: by clicking on the packet envelope as it is displayed in the animation, or by clicking on the Info column for that packet instance as it is listed in the Event List. Play this animation and examine the Packet contents (PDU Information Window, Inbound PDU Details, Outbound PDU Details) for each event in the event list, especially when the packets are at PC 1A or at the Eagle Server. If you receive a “Buffer Full” message, click the View Previous Events button. While the processing of the packets at the switch and the routers may not make sense to you yet, you should be able to see how DNS, UDP, HTTP, and TCP work together by tracing the packets and using the PDU Information window to look “inside” them.
Reflection:
Can you make a diagram of the sequence of protocol events involved in requesting a web page using a URL? Where might things go wrong? Compare and contrast DNS and HTTP, and UDP and TCP.
