4.5.3 Packet Tracer – Application and Transport Layer Protocols Examination Answers
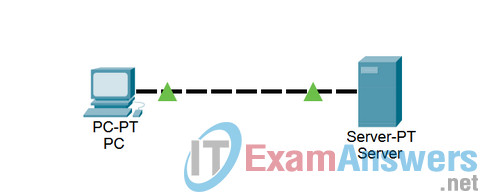
Topology

Addressing Table
This activity does not include an addressing table.
Learning Objectives
- Capture a web request using an URL from a PC
- Run the simulation and capture the traffic
- Examine the captured traffic
Introduction:
Wireshark provides the ability to capture and display all of the network traffic entering and leaving the PC on which it is installed through a network interface. Simulation mode in Packet Tracer captures all network traffic flowing through the entire network but only supports a limited number of protocols. To come as close as possible to approximating Lab 4.5.3 we will use a network consisting of a PC that is directly connected to a web server and capture a request for a web page using an URL.
Task 1: Capture a web request using an URL from a PC.
Step 1. Run the simulation and capture the traffic.
Enter Simulation mode. Click on the PC. Open the Web Browser from the Desktop. Enter www.example.com into the browser. Clicking on Go will initiate a web server request. Minimize the Web Client configuration window. Two packets appear in the Event List, a DNS request needed to resolve the URL to the IP address of the server and an ARP request needed to resolve the IP address of the server to its hardware MAC address.
Click the Auto Capture / Play button to run the simulation and capture events. Click OK when the “No More Events” message is reached.
Step 2. Examine the captured traffic.
Find the first packet in the Event List, and click on the colored square in the Info column. When you click on the Info square for a packet in the event list the PDU Information window opens. The OSI model organizes this window. In the case of the first packet we are viewing, notice the DNS query (at Layer 7) is encapsulated in an UDP segment at Layer 4 and so on. If you click on these layers, the algorithm used by the device (in this case, the PC) is displayed. View what is going on at each layer.
When opening the PDU Information window, the default is the OSI Model view. Now click on the Outbound PDU Details tab. Scroll down to the bottom of this window, and you will see that the DNS query is encapsulated as data in an UDP segment, which is encapsulated in an IP packet.
Examine the PDU information for the remaining events in the exchange.
