7.4.1 Packet Tracer – Packet Tracing Across An Internetwork Answers
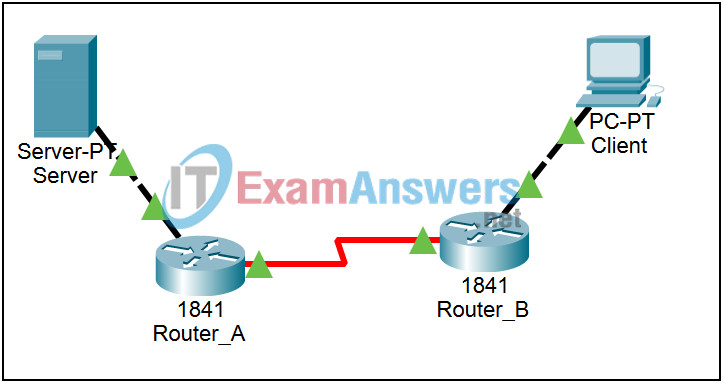
Topology

Learning Objectives
- Trace the HTTP-initiated packets that cross an internetwork as a result of a web page request
- Observe the same situation viewing more than just HTTP-initiated packets
Introduction:
This brief activity is meant to build upon the example in 7.4.1.2 in the curriculum. In that example, ARP, DNS, and TCP processes were assumed to have already occurred, and the example focuses on following HTTP-initiated packets across a small internetwork formed by 2 routers.
Task 1: Trace HTTP-initiated Packets.
Step 1. Initialize the Network.
While in Realtime mode, open the Web Browser from the Desktop of the PC Client. Type 192.0.2.7 into the URL and press the Enter key. The web page should be retrieved. This process helps populate tables so you can focus on just the HTTP-related packets.
Step 2. Set Event List Filters.
Switch to Simulation mode. We only want to capture HTTP events. In the Event List Filters section, click the Edit Filters button. Select only HTTP events. By viewing HTTP events only, DNS, ARP, TCP, and RIP processes are still occurring, but are not displayed. Sometimes, if an HTTP packet is buffered it causes a distinct packet event in the event list that looks like a duplicate but is just a pause before transmitting. This happens because the other protocol events are still occurring, just not visibly.
Step 3. Step through the simulation.
From the PC client’s browser, click the Go button to request the web page again. Click the Capture / Forward button once and examine the packet. Then click Capture / Forward again and again, opening the packet for examination at each step in the process. When you are done analyzing the packets, switch to Realtime mode, and click on the Power Cycle Devices button to reboot the devices. When the link lights turn from red to green, return to Simulation mode.
Task 2: Observe the same situation, viewing more than just HTTP-initiated packets.
Step 1. View more protocols.
In the Event List Filters section, click the Edit Filters button. Select HTTP, DNS, TCP, UDP, ARP, and RIP. This will provide a more realistic view of the network. It is similar to what is observed in a Wireshark capture.
Step 2. Step through the simulation.
Open the Web Browser of the PC client and type eagle-server.example.com into the URL and press the Enter key. Click the Go button. Click the Capture / Forward button repeatedly and view the complexities of this seemingly simple interaction of protocols. After the exchange the routers begin exchanging RIPv2 packets. This exchange will continue indefinitely. Stop after a couple of exchanges. At this point in the course you should start to be able to explain this sequence of packets.
