Lab 2.6.2 – Using Wireshark™ to View Protocol Data Units (Answers)
Learning Objectives
- Be able to explain the purpose of a protocol analyzer (Wireshark).
- Be able to perform basic PDU capture using Wireshark.
- Be able to perform basic PDU analysis on straightforward network data traffic.
- Experiment with Wireshark features and options such as PDU capture and display filtering.
Background
Wireshark is a software protocol analyzer, or “packet sniffer” application, used for network troubleshooting, analysis, software and protocol development, and education. Before June 2006, Wireshark was known as Ethereal.
A packet sniffer (also known as a network analyzer or protocol analyzer) is computer software that can intercept and log data traffic passing over a data network. As data streams travel back and forth over the network, the sniffer “captures” each protocol data unit (PDU) and can decode and analyze its contentm according to the appropriate RFC or other specifications.
Wireshark is programmed to recognize the structure of different network protocols. This enables it to display the encapsulation and individual fields of a PDU and interpret their meaning.
It is a useful tool for anyone working with networks and can be used with most labs in the CCNA courses for data analysis and troubleshooting.
For information and to download the program go to – http://www.Wireshark.org
Scenario
To capture PDUs the computer on which Wireshark is installed must have a working connection to the network and Wireshark must be running before any data can be captured.
When Wireshark is launched, the screen below is displayed.
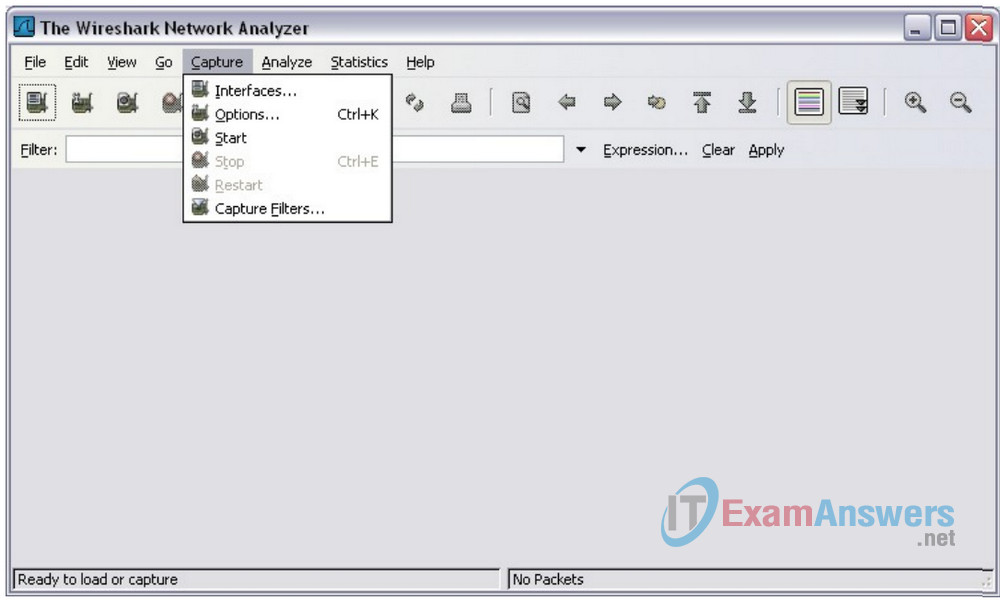
To start data capture it is first necessary to go to the Capture menu and select the Options choice. The Options dialog provides a range of settings and filters which determines which and how much data traffic is captured.
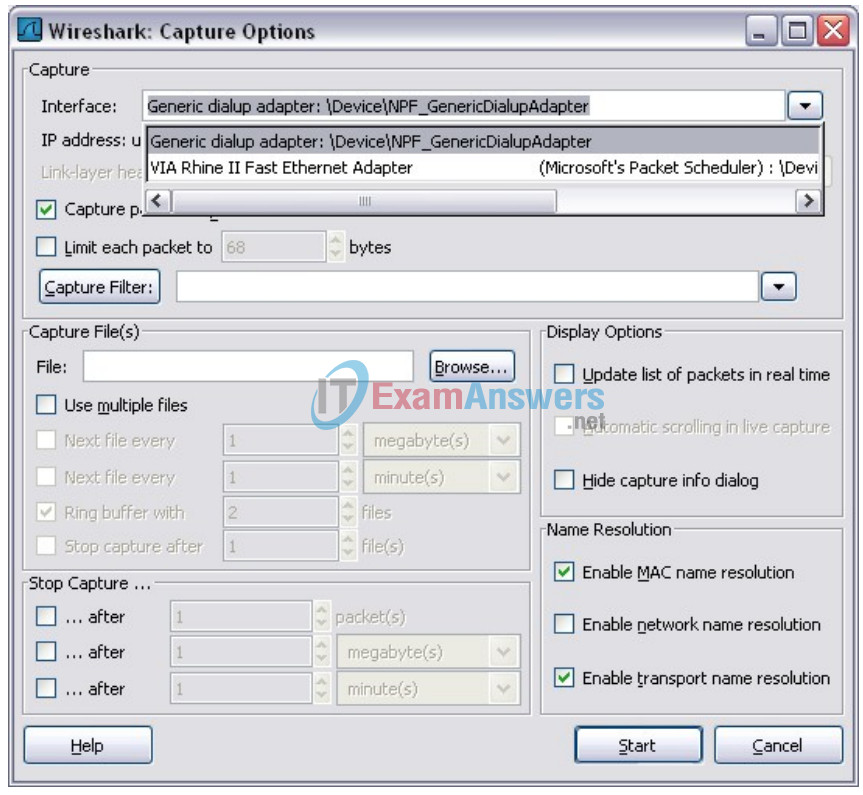
First, it is necessary to ensure that Wireshark is set to monitor the correct interface. From the Interface drop down list, select the network adapter in use. Typically, for a computer this will be the connected Ethernet Adapter.
Then other Options can be set. Among those available in Capture Options, the two highlighted below are worth examination.
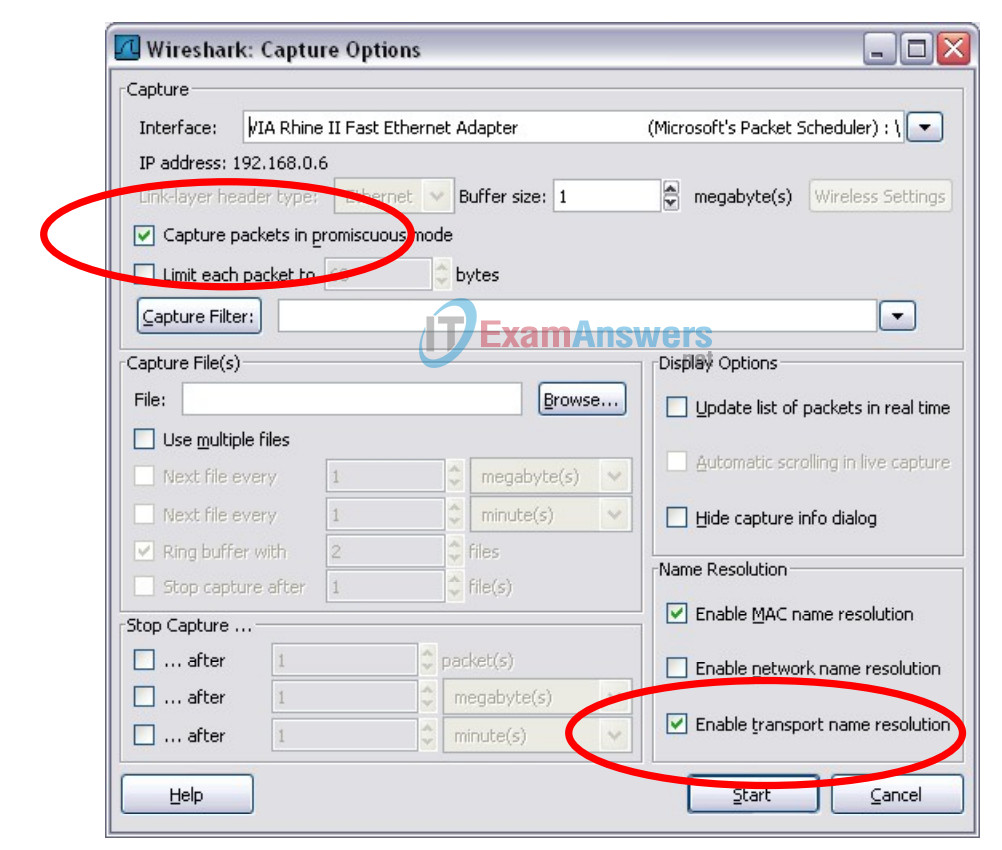
Setting Wireshark to capture packets in promiscuous mode
If this feature is NOT checked, only PDUs destined for this computer will be captured.
If this feature is checked, all PDUs destined for this computer AND all those detected by the computer NIC on the same network segment (i.e., those that “pass by” the NIC but are not destined for the computer) are captured.
Note: The capturing of these other PDUs depends on the intermediary device connecting the end device computers on this network. As you use different intermediary devices (hubs, switches, routers) throughout these courses, you will experience the different Wireshark results.
Setting Wireshark for network name resolution
This option allows you to control whether or not Wireshark translates network addresses found in PDUs into names. Although this is a useful feature, the name resolution process may add extra PDUs to your captured data perhaps distorting the analysis.
There are also a number of other capture filtering and process settings available.
Clicking on the Start button starts the data capture process and a message box displays the progress of this process.
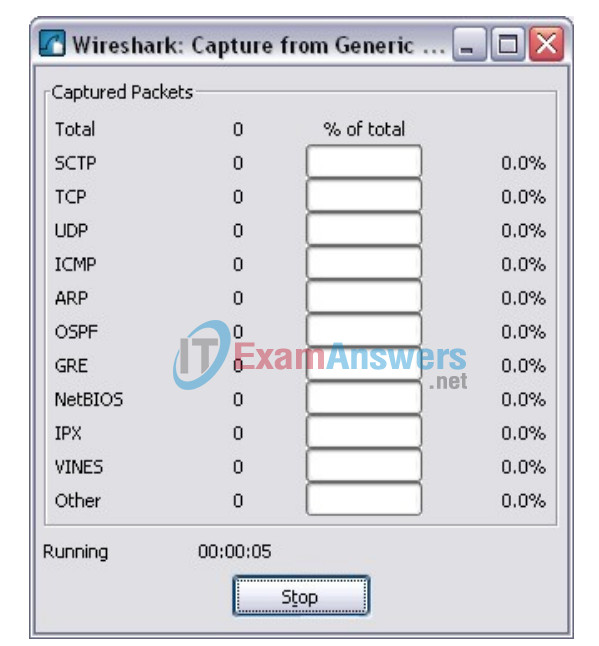
As data PDUs are captured, the types and number are indicated in the message box
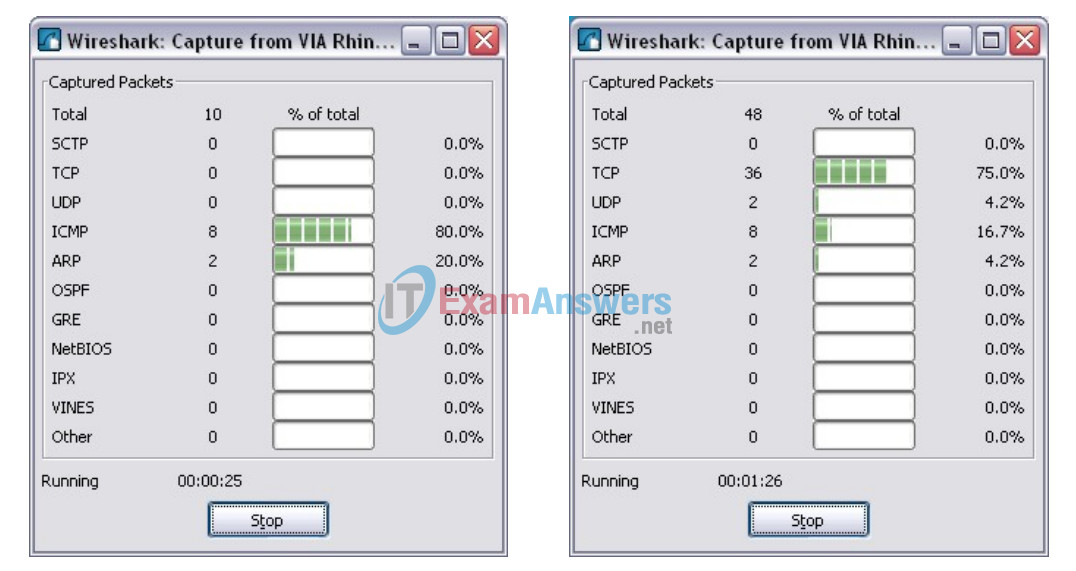
The examples above show the capture of a ping process and then accessing a web page.
When the Stop button is clicked, the capture process is terminated and the main screen is displayed.
This main display window of Wireshark has three panes.
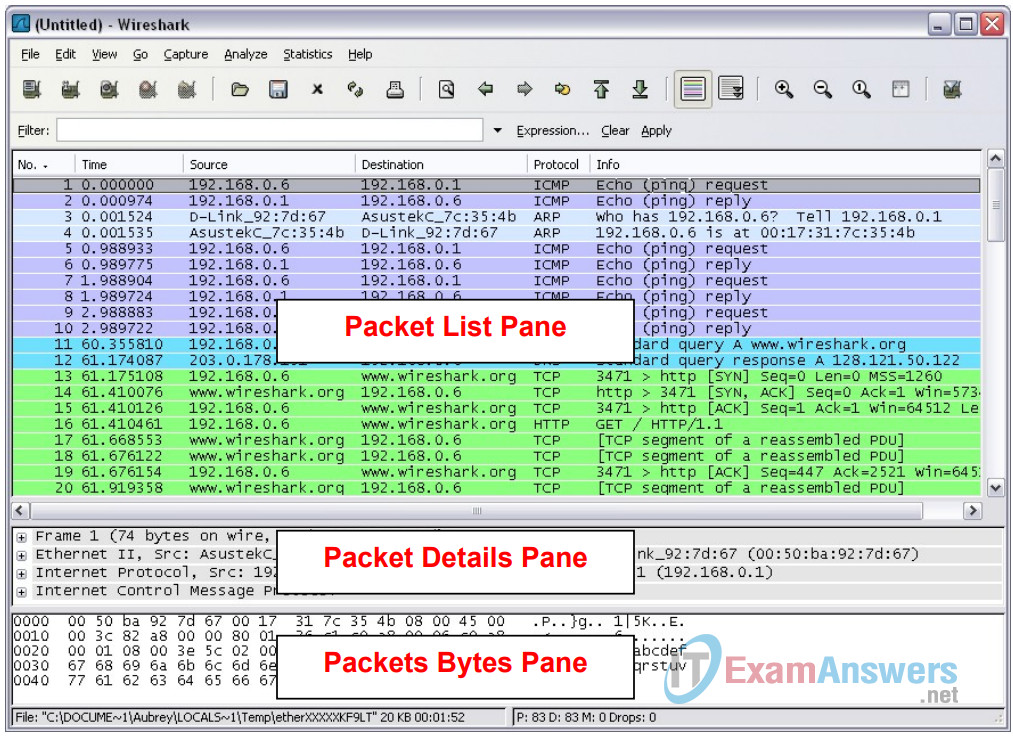
The PDU (or Packet) List Pane at the top of the diagram displays a summary of each packet captured. By clicking on packets in this pane, you control what is displayed in the other two panes.
The PDU (or Packet) Details Pane in the middle of the diagram displays the packet selected in the Packet List Pane in more detail.
The PDU (or Packet) Bytes Pane at the bottom of the diagram displays the actual data (in hexadecimal form representing the actual binary) from the packet selected in the Packet List Pane, and highlights the field selected in the Packet Details Pane.
Each line in the Packet List corresponds to one PDU or packet of the captured data. If you select a line in this pane, more details will be displayed in the “Packet Details” and “Packet Bytes” panes. The example above shows the PDUs captured when the ping utility was used and http://www.Wireshark.org was accessed. Packet number 1 is selected in this pane.
The Packet Details pane shows the current packet (selected in the “Packet List” pane) in a more detailed form. This pane shows the protocols and protocol fields of the selected packet. The protocols and fields of the packet are displayed using a tree, which can be expanded and collapsed.
The Packet Bytes pane shows the data of the current packet (selected in the “Packet List” pane) in what is known as “hexdump” style. In this lab, this pane will not be examined in detail. However, when a more in-depth analysis is required this displayed information is useful for examining the binary values and content of PDUs.
The information captured for the data PDUs can be saved in a file. This file can then be opened in Wireshark for analysis some time in the future without the need to re-capture the same data traffic again. The information displayed when a capture file is opened is the same as the original capture.
When closing a data capture screen or exiting Wireshark you are prompted to save the captured PDUs.

Clicking on Continue without Saving closes the file or exits Wireshark without saving the displayed captured data.
Task 1: Ping PDU Capture
Step 1: After ensuring that the standard lab topology and configuration is correct, launch Wireshark on a computer in a lab pod.
Set the Capture Options as described above in the overview and start the capture process.
From the command line of the computer, ping the IP address of another network connected and powered on end device on in the lab topology. In this case, ping the Eagle Server at using the command ping 192.168.254.254.
After receiving the successful replies to the ping in the command line window, stop the packet capture.
Step 2: Examine the Packet List pane.
The Packet List pane on Wireshark should now look something like this:
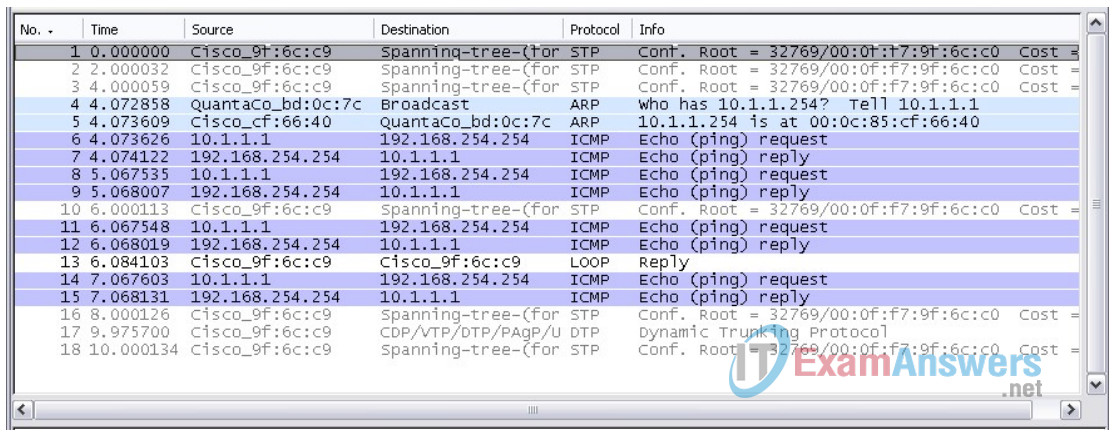
Look at the packets listed above; we are interested in packet numbers 6, 7, 8, 9, 11, 12, 14 and 15.
Locate the equivalent packets on the packet list on your computer.
If you performed Step 1A above match the messages displayed in the command line window when the ping was issued with the six packets captured by Wireshark.
From the Wireshark Packet List answer the following:
What protocol is used by ping?
ICMP
What is the full protocol name?
Internet Control Message Protocol
What are the names of the two ping messages?
Echo Request
Echo Reply
Are the listed source and destination IP addresses what you expected? Yes / No
Why?
Answers may vary
– Yes, the source address is my computer and the destination is the Eagle server
Step 3: Select (highlight) the first echo request packet on the list with the mouse.
The Packet Detail pane will now display something similar to:

Click on each of the four “+” to expand the information.
The packet Detail Pane will now be similar to:
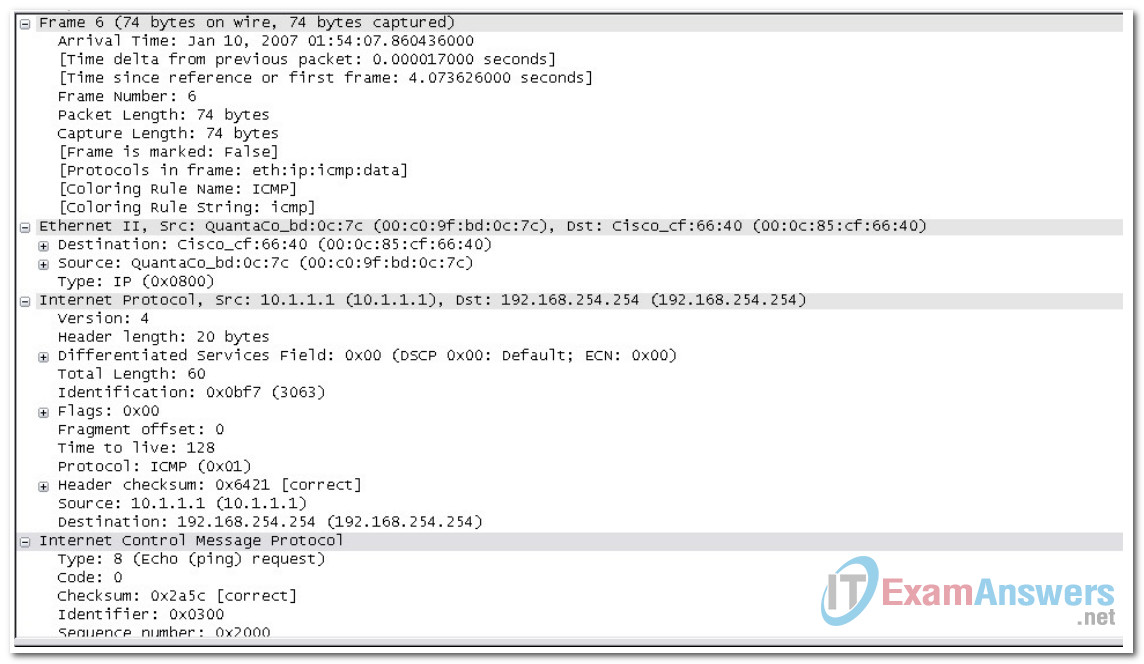
As you can see, the details for each section and protocol can be expanded further. Spend some time scrolling through this information. At this stage of the course, you may not fully understand the information displayed but make a note of the information you do recognize.
Locate the two different types of ‘Source” and “Destination”. Why are there two types?
The Ethernet II shows the MAC addresses and the Internet Protocol shows the IP addresses
What protocols are in the Ethernet frame?
eth:ip:icmp:data
As you select a line in the Packets Detail pane all or part of the information in the Packet Bytes pane also becomes highlighted.
For example, if the second line (+ Ethernet II) is highlighted in the Details pane the Bytes pane now highlights the corresponding values.

This shows the particular binary values that represent that information in the PDU. At this stage of the course, it is not necessary to understand this information in detail.
Step 4: Go to the File menu and select Close.
Click on Continue without Saving when this message box appears.

Task 2: FTP PDU Capture
Step 1: Start packet capture.
Assuming Wireshark is still running from the previous steps, start packet capture by clicking on the Start option on the Capture menu of Wireshark.
At the command line on your computer running Wireshark, enter ftp 192.168.254.254
When the connection is established, enter anonymous as the user without a password.
Userid: anonymous
Password: <ENTER>
You may alternatively use login with userid cisco and with password cisco.
When successfully logged in enter get /pub/eagle_labs/eagle1/chapter1/gaim-1.5.0.exe and press the enter key <ENTER>. This will start downloading the file from the ftp server. The output will look similar to:
C:\Documents and Settings\ccna1>ftp eagle-server.example.com
Connected to eagle-server.example.com.
220 Welcome to the eagle-server FTP service.
User (eagle-server.example.com:(none)): anonymous
331 Please specify the password.
Password:<ENTER>
230 Login successful.
ftp> get /pub/eagle_labs/eagle1/chapter1/gaim-1.5.0.exe
200 PORT command successful. Consider using PASV.
150 Opening BINARY mode data connection for
pub/eagle_labs/eagle1/chapter1/gaim-1.5.0.exe (6967072 bytes).
226 File send OK.
ftp: 6967072 bytes received in 0.59Seconds 11729.08Kbytes/sec.
When the file download is complete enter quit
ftp> quit
221 Goodbye.
C:\Documents and Settings\ccna1>
When the file has successfully downloaded, stop the PDU capture in Wireshark.
Step 2: Increase the size of the Wireshark Packet List pane and scroll through the PDUs listed.
Locate and note those PDUs associated with the file download.
These will be the PDUs from the Layer 4 protocol TCP and the Layer 7 protocol FTP.
Identify the three groups of PDUs associated with the file transfer.
If you performed the step above, match the packets with the messages and prompts in the FTP command line window.
The first group is associated with the “connection” phase and logging into the server.
List examples of messages exchanged in this phase.
Answers will vary- 1292 > ftp [SYN], FTP > 1292 [SYN, ACK], Response: 220 Welcome to the eagle-server FTP service, 1292 > ftp [ACK], Request: User anonymous, Response: 331 Please specify the password, Request: Pass
Locate and list examples of messages exchanged in the second phase that is the actual download request and the data transfer.
Answers will vary- FTP Data: 1448 bytes, 1294 > ftp-data [ACK],
The third group of PDUs relate to logging out and “breaking the connection”.
List examples of messages exchanged during this process.
Answers will vary- Request:QUIT, Response: 221 Goodbye, 1292 > ftp [FIN, ACK], ftp >1292 [FIN, ACK]
Locate recurring TCP exchanges throughout the FTP process. What feature of TCP does this indicate?
Send and receipt of data
Step 3: Examine Packet Details.
Select (highlight) a packet on the list associated with the first phase of the FTP process.
View the packet details in the Details pane.
What are the protocols encapsulated in the frame?
Eth:ip:tcp:ftp-data
Highlight the packets containing the user name and password.
Examine the highlighted portion in the Packet Byte pane.
What does this say about the security of this FTP login process?
Security isn’t very high because the name and password are visible.
Highlight a packet associated with the second phase.
From any pane, locate the packet containing the file name.
The filename is:
gaim-1.5.0.exe
Highlight a packet containing the actual file content – note the plain text visible in the Byte pane.
Highlight and examine, in the Details and Byte panes, some packets exchanged in the third phase of the file download.
What features distinguish the content of these packets?
A [FIN, ACK] is issued to close the connection.
When finished, close the Wireshark file and continue without saving
Task 3: HTTP PDU Capture
Step 1: Start packet capture.
Assuming Wireshark is still running from the previous steps, start packet capture by clicking on the Start option on the Capture menu of Wireshark.
Note: Capture Options do not have to be set if continuing from previous steps of this lab.
Launch a web browser on the computer that is running Wireshark.
Enter the URL of the Eagle Server of example.com or enter the IP address-192.168.254.254. When the webpage has fully downloaded, stop the Wireshark packet capture.
Step 2: Increase the size of the Wireshark Packet List pane and scroll through the PDUs listed.
Locate and identify the TCP and HTTP packets associated with the webpage download.
Note the similarity between this message exchange and the FTP exchange.
Step 3: In the Packet List pane, highlight an HTTP packet that has the notation “(text/html)” in the Info column.
In the Packet Detail pane click on the “+” next to “Line-based text data: html”
When this information expands what is displayed?
HTML code for the web page
Examine the highlighted portion of the Byte Panel.
This shows the HTML data carried by the packet.
When finished close the Wireshark file and continue without saving
Task 4: Reflection
Consider the encapsulation information pertaining to captured network data Wireshark can provide. Relate this to the OSI and TCP/IP layer models. It is important that you can recognize and link both the protocols represented and the protocol layer and encapsulation types of the models with the information provided by Wireshark.
Task 5: Challenge
Discuss how you could use a protocol analyzer such as Wireshark to:
1. Troubleshoot the failure of a webpage to download successfully to a browser on a computer. and
2. Identify data traffic on a network that is requested by users.
Answers could vary- Wireshark could show when request for a web page failed due to incorrect URL. User traffic could be monitored to identify errors in source or destination.
Task 6: Cleanup
Unless instructed otherwise by your instructor, exit Wireshark and properly shutdown the computer.
