Objectives
Upon completion of this chapter, you will be able to answer the following questions:
- What is the behavior of common network protocols in the context of security monitoring?
- How do security technologies affect the ability to monitor common network protocols?
- What are the types of data used in security monitoring?
- What are the elements of an end device log file?
- What are the elements of a network device log file?
Key Terms
This chapter uses the following key terms. You can find the definitions in the Glossary.
Tor
load balancing
Snort
Sguil
session data
Bro
transaction data
statistical data
tcpdump
NextGen IPS
Introduction (11.0)
Network security monitoring (NSM) uses various types of data to detect, verify, and contain exploits. The primary task of the cybersecurity analyst is to verify successful or attempted exploits using NSM data and tools.
In this chapter, you will learn about the security technologies and log files used in security monitoring.
Technologies and Protocols (11.1)
In this section, you will learn how security technologies affect security monitoring.
Monitoring Common Protocols (11.1.1)
In this topic, you will learn the behavior of common network protocols in the context of security monitoring.
Syslog and NTP (11.1.1.1)
Various protocols that commonly appear on networks have features that make them of special interest in security monitoring. For example, syslog and Network Time Protocol (NTP) are essential to the work of the cybersecurity analyst.
The syslog standard is used for logging event messages from network devices and endpoints, as shown in Figure 11-1.

Figure 11-1 Syslog Operation
The standard allows for a system-neutral means of transmitting, storing, and analyzing messages. Many types of devices from many different vendors can use syslog to send log entries to central servers that run a syslog daemon. This centralization of log collection helps to make security monitoring practical.
Servers that run syslog typically listen on UDP port 514.
Because syslog is so important to security monitoring, syslog servers may be a target for threat actors. Some exploits, such as those involving data exfiltration, can take a long time to complete due to the very slow ways in which data is secretly stolen from the network. Some attackers may try to hide the fact that exfiltration is occurring. They attack syslog servers that contain the information that could lead to detection of the exploit. Hackers may attempt to block the transfer of data from syslog clients to servers, tamper with or destroy log data, or tamper with software that creates and transmits log messages. The next generation (ng) syslog implementation, known as syslog-ng, offers enhancements that can help prevent some of the exploits that target syslog.
NTP (11.1.1.2)
Syslog messages are usually timestamped. This allows messages from different sources to be organized by time to provide a view of network communication processes. Because the messages can come from many devices, it is important that the devices share a consistent time clock. One way that this can be achieved is for the devices to use Network Time Protocol (NTP). NTP uses a hierarchy of authoritative time sources to share time information between devices on the network, as shown in Figure 11-2. In this way, device messages that share consistent time information can be submitted to the syslog server. NTP operates on UDP port 123.
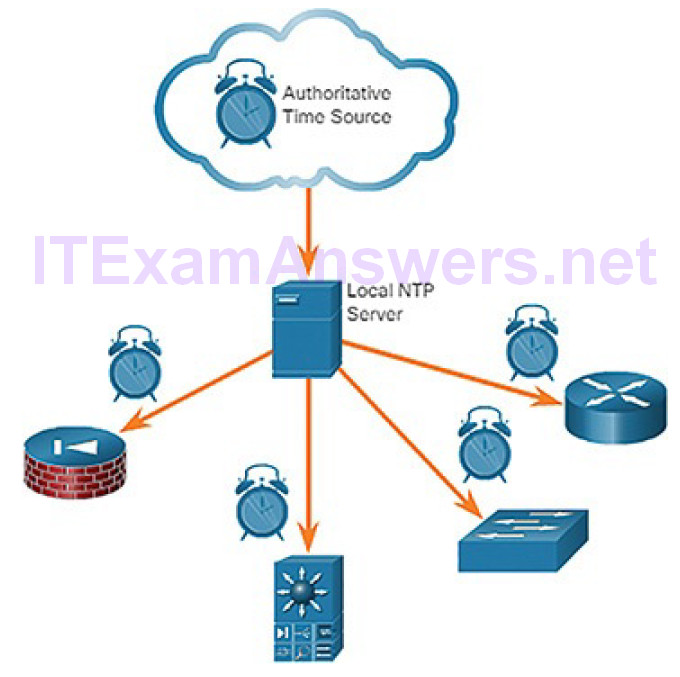
Figure 11-2 NTP Operation
Because events that are connected to an exploit can leave traces across every network device on their path to the target system, timestamps are essential for detection. Threat actors may attempt to attack the NTP infrastructure in order to corrupt time information used to correlate logged network events. This can serve to obfuscate traces of ongoing exploits. In addition, threat actors have been known to use NTP systems to direct DDoS attacks through vulnerabilities in client or server software. While these attacks do not necessarily result in corrupted security monitoring data, they can disrupt network availability.
DNS (11.1.1.3)
Domain Name Service (DNS) is used by millions of people daily. Because of this, many organizations have less stringent policies in place to protect against DNS-based threats than they have to protect against other types of exploits. Attackers have recognized this and commonly encapsulate different network protocols within DNS to evade security devices. DNS is now used by many types of malware. Some varieties of malware use DNS to communicate with command-and-control (CnC) servers and to exfiltrate data in traffic disguised as normal DNS queries. Various types of encoding, such as Base64, 8-bit binary,and Hex, can be used to camouflage the data and evade basic data loss prevention (DLP) measures.
For example, malware could encode stolen data as the subdomain portion of a DNS lookup for a domain where the name server is under control of an attacker. A DNS lookup for “long-string-of-exfiltrated-data.example.com” would be forwarded to the name server of example.com, which would record “long-string-of-exfiltrated-data” and reply to the malware with a coded response. This use of the DNS subdomain is shown in Figure 11-3. The exfiltrated data is the encoded text shown in the box. The threat actor collects this encoded data, decodes and combines it, and now has access to an entire data file, such as a username/password database.
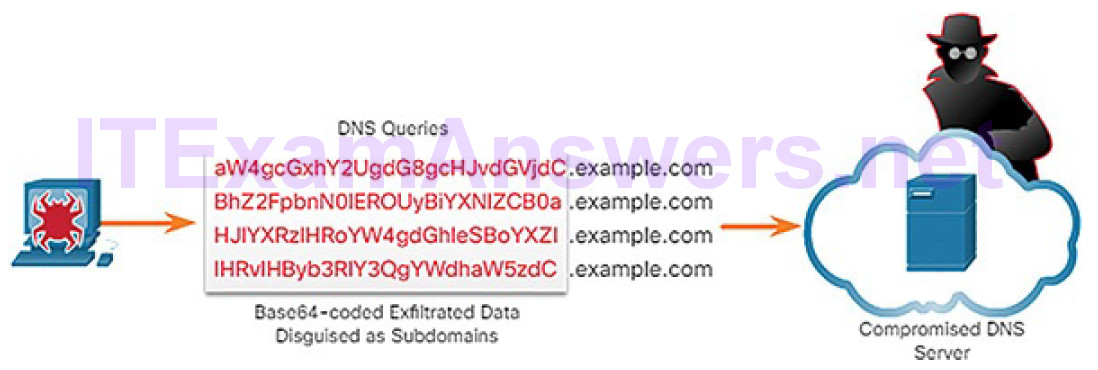
Figure 11-3 DNS Exfiltration
It is likely that the subdomain part of such requests would be much longer than usual requests. Cyberanalysts can use the distribution of the lengths of subdomains within DNS requests to construct a mathematical model that describes normality. They can then use this to compare their observations and identify an abuse of the DNS query process. For example, it would not be normal to see a host on your network sending a query to aW4gcGxhY2UgdG8gcHJvdGVjdC.example.com.
DNS queries for randomly generated domain names, or extremely long random-appearing subdomains, should be considered suspicious, especially if their occurrence spikes dramatically on the network. DNS proxy logs can be analyzed to detect these conditions. Alternatively, services such as the Cisco Umbrella passive DNS service can be used to block requests to suspected CnC and exploit domains.
HTTP and HTTPS (11.1.1.4)
Hypertext Transfer Protocol (HTTP) is the backbone protocol of the World Wide Web. However, all information carried in HTTP is transmitted in plaintext from the source computer to the destination on the Internet. HTTP does not protect data from alteration or interception by malicious parties, which is a serious threat to privacy, identity, and information security. All browsing activity should be considered to be at risk.
A common exploit of HTTP is called iFrame (inline frame) injection. Most web-based threats consist of malware scripts that have been planted on web servers. These web servers then direct browsers to infected servers by loading iFrames. In iFrame injection, a threat actor compromises a web server and plants malicious code that creates an invisible iFrame on a commonly visited web page. When the iFrame loads, malware is downloaded, frequently from a different URL than the web page that contains the iFrame code. Network security services, such as Cisco Web Reputation filtering, can detect when a website attempts to send content from an untrusted website to the host, even when sent from an iFrame, as shown in Figure 11-4.
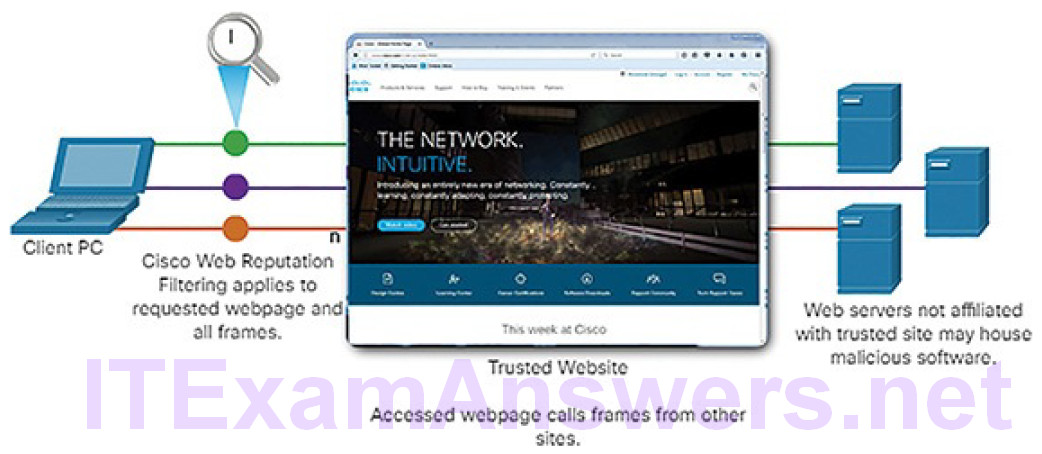
Figure 11-4 HTTP iFrame Injection Exploit
To address the alteration or interception of confidential data, many commercial organizations have adopted HTTPS or implemented HTTPS-only policies to protect visitors to their websites and services.
HTTPS adds a layer of encryption to the HTTP protocol by using Secure SocketsLayer (SSL)/Transport Layer Security (TLS), as shown in Figure 11-5. This makes the HTTP data unreadable as it leaves the source computer until it reaches the server. Note that HTTPS is not a mechanism for web server security. It only secures HTTP protocol traffic while it is in transit.
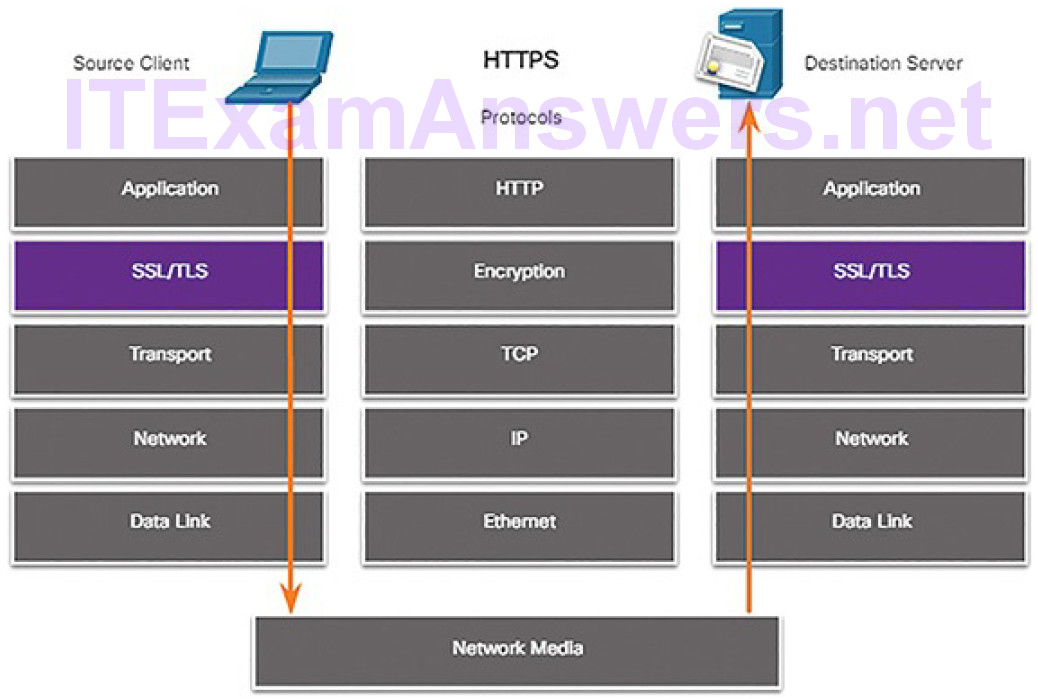
Figure 11-5 HTTPS Protocol Diagram
Note
Although you may still encounter SSL implemented in some websites, the Internet Engineering Task Force (IETF) deprecated it in June 2015 in RFC 7568. Any version of TLS is more secure than SSL.
Unfortunately, the encrypted HTTPS traffic complicates network security monitoring. Some security devices include SSL decryption and inspection; however, this can present processing and privacy issues. In addition, HTTPS adds complexity to packet captures due to the additional messaging involved in establishing the encrypted connection. This process is summarized in Figure 11-6 and represents additional overhead on top of HTTP.
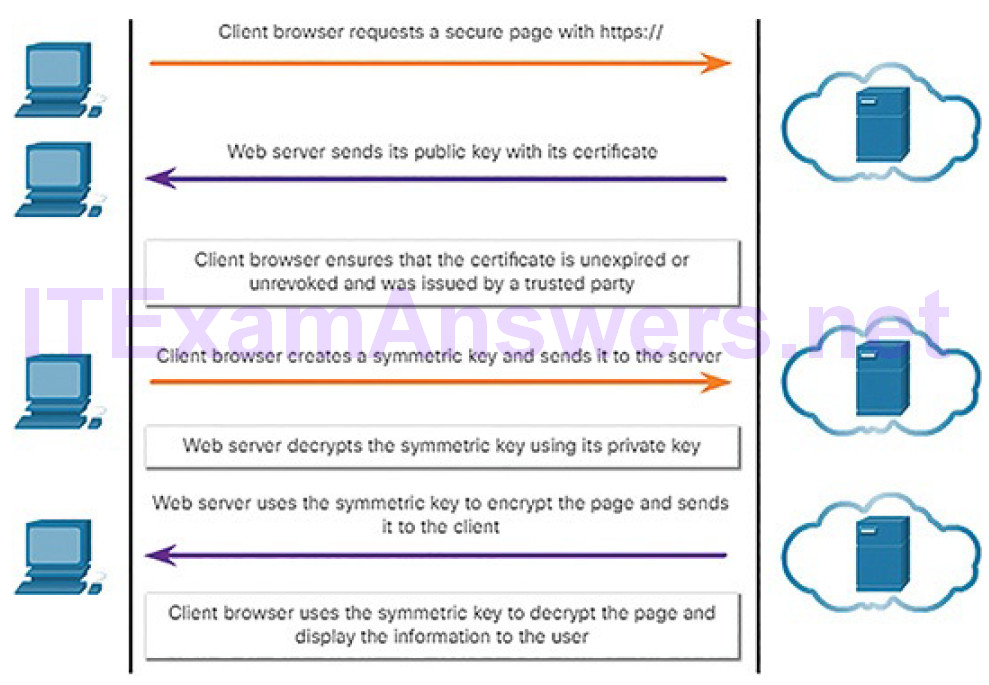
Figure 11-6 HTTPS Transactions
Email Protocols (11.1.1.5)
Email protocols such as SMTP, POP3, and IMAP can be used by threat actors to spread malware, exfiltrate data, or provide channels to malware CnC servers, as shown in Figure 11-7.
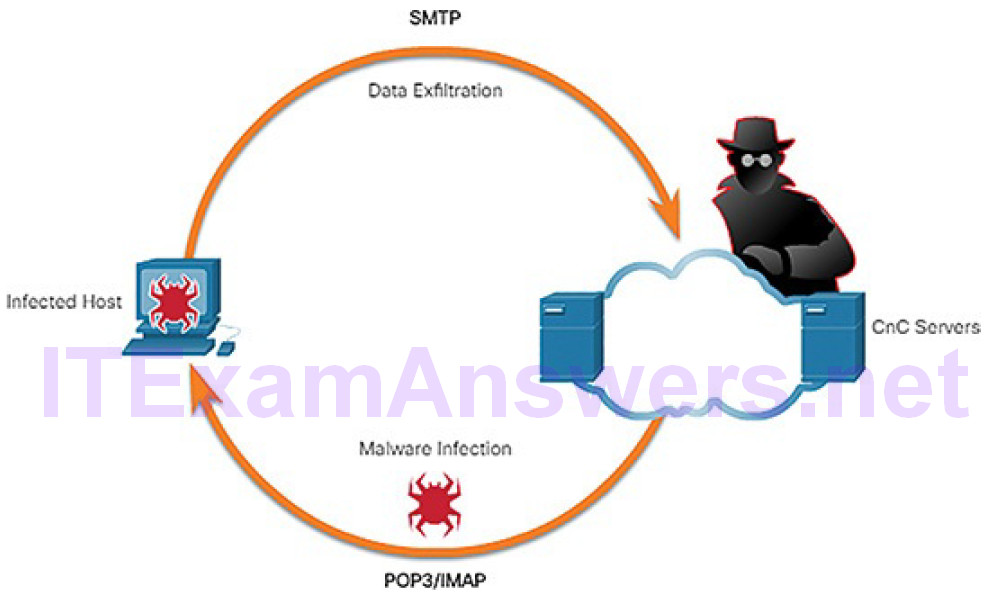
Figure 11-7 Email Protocol Threats
SMTP sends data from a host to a mail server and between mail servers. Like DNS and HTTP, it is a common protocol to see leaving the network. Because there is so much SMTP traffic, it is not always monitored. However, SMTP has been used in the past by malware to exfiltrate data from the network. In the 2014 hack of Sony Pictures, one of the exploits used SMTP to exfiltrate user details from compromised hosts to CnC servers. This information may have been used to help develop exploits of secured resources within the Sony Pictures network. Security monitoring could reveal this type of traffic based on features of the email message.
IMAP and POP3 are used to download email messages from a mail server to the host computer. For this reason, they are the application protocols that are responsible for bringing malware to the host. Security monitoring can identify when a malware attachment entered the network and which host it first infected.
Retrospective analysis can then track the behavior of the malware from that point forward. In this way, the malware behavior can better be understood and the threat identified. Security monitoring tools may also allow recovery of infected file attachments for submission to malware sandboxes for analysis.
ICMP (11.1.1.6)
Internet Control Message Protocol (ICMP) has many legitimate uses. However, the ICMP functionality has been used to craft a number of types of exploits. ICMP can be used to identify hosts on a network, map the structure of a network, and determine the operating systems at use on the network. It can also be used as a vehicle for various types of DoS attacks.
ICMP can also be used for data exfiltration. Because of the concern that ICMP can be used to surveil or deny service from outside of the network, ICMP traffic from inside the network is sometimes overlooked. However, some varieties of malware use crafted ICMP packets to transfer files from infected hosts to threat actors using this method, which is known as ICMP tunneling.
A number of tools exist for crafting tunnels, such as Hans and Ping Tunnel.
Activity 11.1.1.7: Identify the Monitored Protocol
Refer to the online course to complete this Activity.
Security Technologies (11.1.2)
In this topic, you will learn how security technologies affect the ability to monitor common network protocols.
ACLs (11.1.2.1)
Many technologies and protocols can have impacts on security monitoring. Access control lists (ACLs) are among these technologies. ACLs can give a false sense of security if they are overly relied upon. ACLs, and packet filtering in general, are technologies that contribute to an evolving set of network security protections.
Figure 11-8, Example 11-1, and Example 11-2 illustrate the use of ACLs to permit only specific types of ICMP traffic.

Figure 11-8 Mitigating ICMP Abuse
Example 11-1 Rules on R1 for ICMP Traffic from the Internet
access-list 112 permit icmp any any echo-reply
access-list 112 permit icmp any any source-quench
access-list 112 permit icmp any any unreachable
access-list 112 deny icmp any any
access-list 112 permit ip any any
Example 11-2 Rules of R1 for ICMP Traffic from Inside the Network
access-list 114 permit icmp 192.168.1.0 0.0.0.255 any echo
access-list 114 permit icmp 192.168.1.0 0.0.0.255 any parameterproblem
access-list 114 permit icmp 192.168.1.0 0.0.0.255 any packet-too-big
access-list 114 permit icmp 192.168.1.0 0.0.0.255 any source-quench
access-list 114 deny icmp any any
access-list 114 permit ip any any
The server at 192.168.1.10 is part of the inside network and is allowed to send ping requests to the outside host at 209.165.201.3. The outside host’s return ICMP traffic is allowed if it is an ICMP reply, source quench (tells the source to reduce the pace of traffic), or any ICMP unreachable message. All other ICMP traffic types are denied. For example, the outside host cannot initiate a ping request to the inside host. The outbound ACL is allowing ICMP messages that report various problems. This will allow ICMP tunneling and data exfiltration.
Attackers can determine which IP addresses, protocols, and ports are allowed by ACLs. This can be done either by port scanning or penetration testing, or through other forms of reconnaissance. Attackers can craft packets that use spoofed source IP addresses. Applications can establish connections on arbitrary ports. Other features of protocol traffic can also be manipulated, such as the established flag in TCP segments. Rules cannot be anticipated and configured for all emerging packet manipulation techniques.
To detect and react to packet manipulation, more sophisticated behavior and context-based measures need to be taken. Cisco Next-Generation Firewalls (NGFW), Advanced Malware Protection (AMP), and Email and Web Security Appliances (ESA and WSA) can address the shortcomings of rule-based security measures.
NAT and PAT (11.1.2.2)
Network Address Translation (NAT) and Port Address Translation (PAT) can complicate security monitoring. Multiple IP addresses are mapped to one or more public addresses that are visible on the Internet, hiding the individual IP addresses that are inside the network (inside addresses).
Figure 11-9 illustrates the relationship between internal and external addresses that are used as source addresses (SA) and destination addresses (DA).
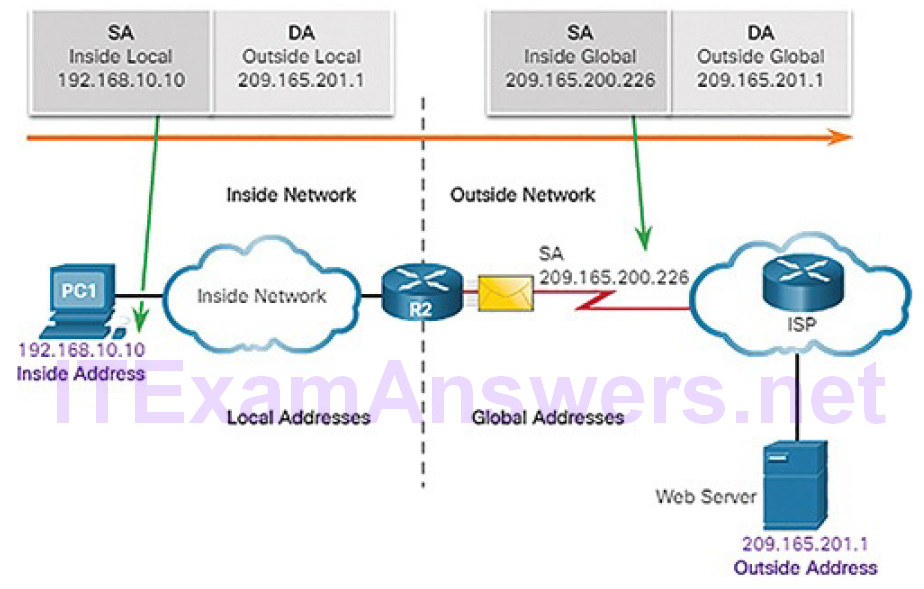
Figure 11-9 NAT Example
These internal and external addresses are in a network that is using NAT to communicate with a destination on the Internet. If PAT is in effect, and all IP addresses leaving the network use the 209.165.200.226 inside global address for traffic to the Internet, it could be difficult to log the specific inside device that is requesting and receiving the traffic when it enters the network.
This problem can be especially relevant with NetFlow data. NetFlow flows are unidirectional and are defined by the addresses and ports that they share. NAT will essentially break a flow that passes a NAT gateway, making flow information beyond that point unavailable. Cisco offers security products that will “stitch” flows together even if the IP addresses have been replaced by NAT.
NetFlow is discussed in more detail later in the chapter.
Encryption, Encapsulation, and Tunneling (11.1.2.3)
As mentioned with HTTPS, encryption can present challenges to security monitoring by making packet details unreadable. Encryption is part of VPN technologies. In VPNs, a commonplace protocol like IP is used to carry encrypted traffic. The encrypted traffic essentially establishes a virtual point-to-point connection between networks over public facilities. Encryption makes the traffic unreadable to any other devices but the VPN endpoints.
A similar technology can be used to create a virtual point-to-point connection between an internal host and threat actor devices. Malware can establish an encrypted tunnel that rides on a common and trusted protocol, and use it to exfiltrate data from the network. A similar method of data exfiltration was discussed previously for DNS.
Peer-to-Peer Networking and Tor (11.1.2.4)
In peer-to-peer (P2P) networking, shown in Figure 11-10, hosts can operate in both client and server roles.
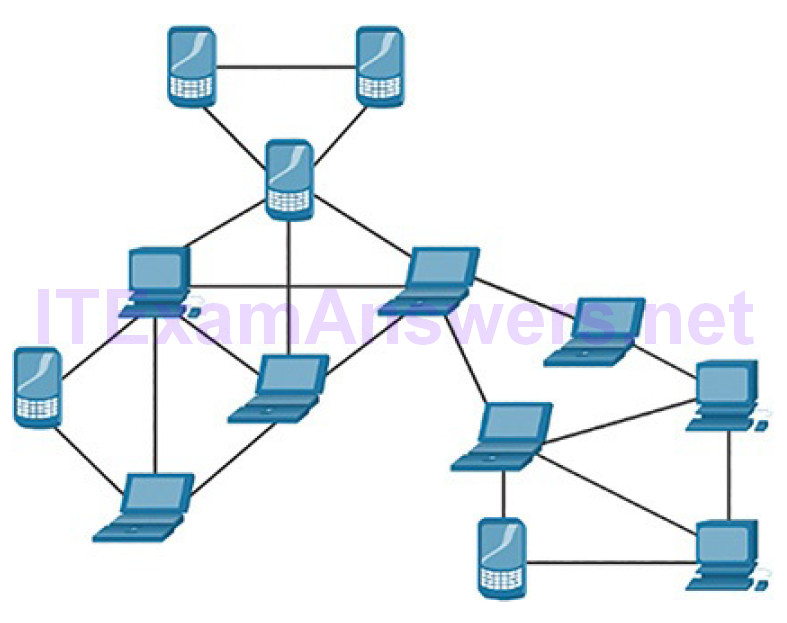
Figure 11-10 P2P Topology Example
Three types of P2P applications exist: file sharing, processor sharing, and instant messaging. In file-sharing P2P, files on a participating machine are shared with members of the P2P network. Examples of this are the once-popular Napster and Gnutella. Bitcoin is a P2P operation that involves the sharing of a distributed database, or ledger, that records Bitcoin balances and transactions. BitTorrent is a P2P file-sharing network.
Any time that unknown users are provided access to network resources, security is a concern. File-sharing P2P applications should not be allowed on corporate networks. P2P network activity can circumvent firewall protections and is a common vector for the spread of malware. P2P is inherently dynamic. It can operate by connecting to numerous destination IP addresses, and it can also use dynamic port numbering. Shared files are often infected with malware, and threat actors can position their malware on P2P clients for distribution to other users.
Processor-sharing P2P networks donate processor cycles to distributed computational tasks. Cancer research, searching for extraterrestrials, and scientific research use donated processor cycles to distribute computational tasks.
Instant messaging (IM) is also considered to be a P2P application. IM has legitimate value within organizations that have geographically distributed projectteams. In this case, specialized IM applications are available, such as the Cisco Jabber platform, which are more secure than IM that uses public servers.
Tor is a software platform and network of P2P hosts that function as Internet routers on the Tor network. The Tor network allows users to browse the Internet anonymously. Users access the Tor network by using a special browser. When a browsing session is begun, the browser constructs a layered end-to-end path across the Tor server network that is encrypted, as shown in Figure 11-11.
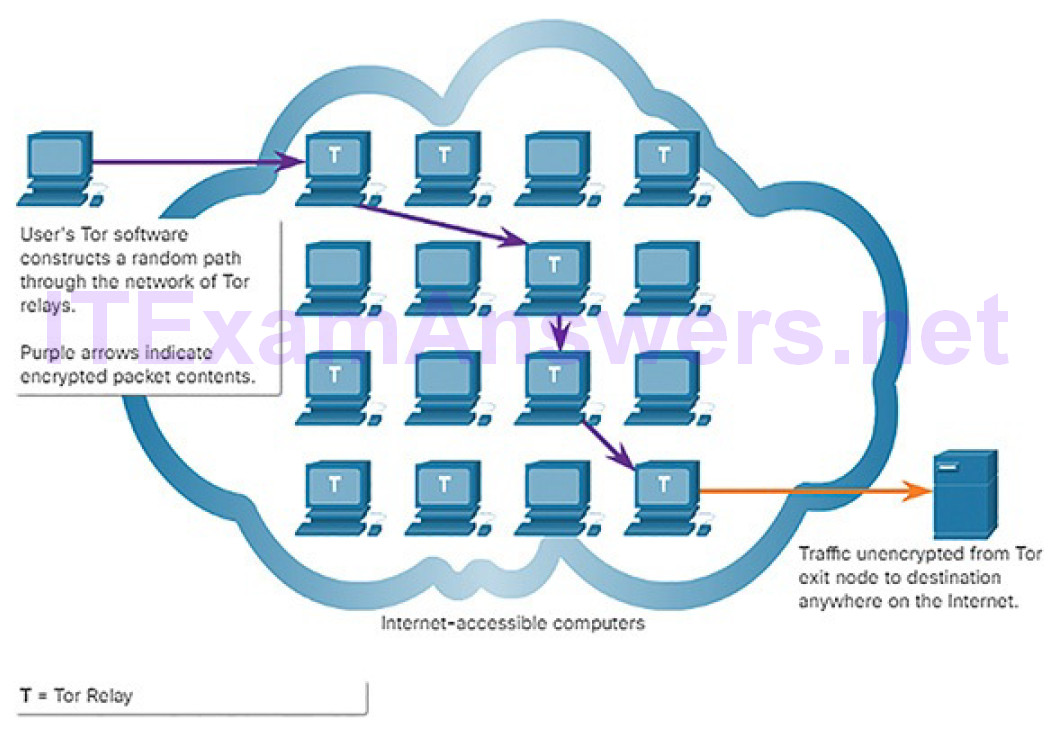
Figure 11-11 Tor Operation
Each encrypted layer is “peeled away” like the layers of an onion (hence “onion routing”) as the traffic traverses a Tor relay. The layers contain encrypted next-hop information that can only be read by the router that needs to read the information. In this way, no single device knows the entire path to the destination, and routing information is readable only by the device that requires it. Finally, at the end of the Tor path, the traffic reaches its Internet destination. When traffic is returned to the source, an encrypted layered path is again constructed.
Tor presents a number of challenges to cybersecurity analysts. First, Tor iswidely used by criminal organizations on the “dark net.” In addition, Tor has been used as a communications channel for malware CnC. Because the destination IP address of Tor traffic is obfuscated by encryption, with only the next-hop Tor node known, Tor traffic avoids blacklists that have been configured on security devices.
Load Balancing (11.1.2.5)
Load balancing involves the distribution of traffic between devices or network paths to prevent overwhelming network resources with too much traffic. If redundant resources exist, a load balancing algorithm or device will work to distribute traffic between those resources, as shown in Figure 11-12.
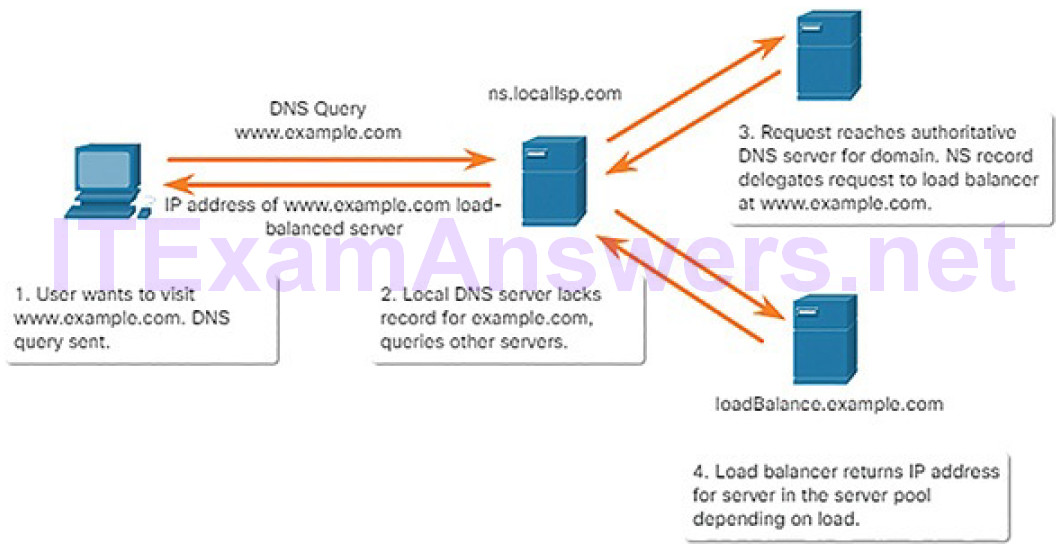
Figure 11-12 Load Balancing with DNS Delegation
One way this is done on the Internet is through various techniques that use DNS to send traffic to resources that have the same domain name but multiple IP addresses. In some cases, the distribution may be to servers that are distributed geographically. This can result in a single Internet transaction being represented by multiple IP addresses on the incoming packets. This may cause suspicious features to appear in packet captures. In addition, some load balancing manager (LBM) devices use probes to test for the performance of different paths and the health of different resources. For example, an LBM may send probes to thedifferent servers that it is load balancing traffic to in order to detect that the servers are operating. This is done to avoid sending traffic to a resource that is not available. These probes can appear to be suspicious traffic if the cybersecurity analyst is not aware that this traffic is part of the operation of the LBM.
Activity 11.1.2.6: Identify the Impact of the Technology on Security and Monitoring
Refer to the online course to complete this Activity.
Log Files (11.2)
In this section, you will learn the types of log files used in security monitoring
Types of Security Data (11.2.1)
In this topic, you will learn the types of data used in security monitoring.
Alert Data (11.2.1.1)
Alert data consists of messages generated by intrusion prevention systems (IPSs) or intrusion detection systems (IDSs) in response to traffic that violates a rule or matches the signature of a known exploit. A network-based IDS (NIDS), such as Snort, comes configured with rules for known exploits. Alerts are generated by Snort and are made readable and searchable by applications such as Snorby and Sguil, which are part of the Security Onion suite of NSM tools.
A testing site that is used to determine whether Snort is operating is www.testmyids.com. It consists of a web page that displays only the text uid=0(root) gid=0(root) groups=0(root). If Snort is operating correctly and a host visits this site, a signature will be matched and an alert will be triggered.
This is an easy and harmless way to verify that the NIDS is running.
The Snort rule that is triggered is
alert ip any any -> any any (msg:"GPL ATTACK_RESPONSE id checkreturned root";
content:"uid=0|28|root|29|"; fast_pattern:only; classtype:badunknown;
sid:2100498; rev:8;)
This rule generates an alert if any IP address in the network receives data from an external source that contains the text matching the pattern of uid=0(root).
The alert contains the message GPL ATTACK_RESPONSE id check returned root. The ID of the Snort rule that was triggered is 2100498.
Figure 11-13 illustrates a series of alerts that have been accessed and displayed on the Security Onion console application Sguil.
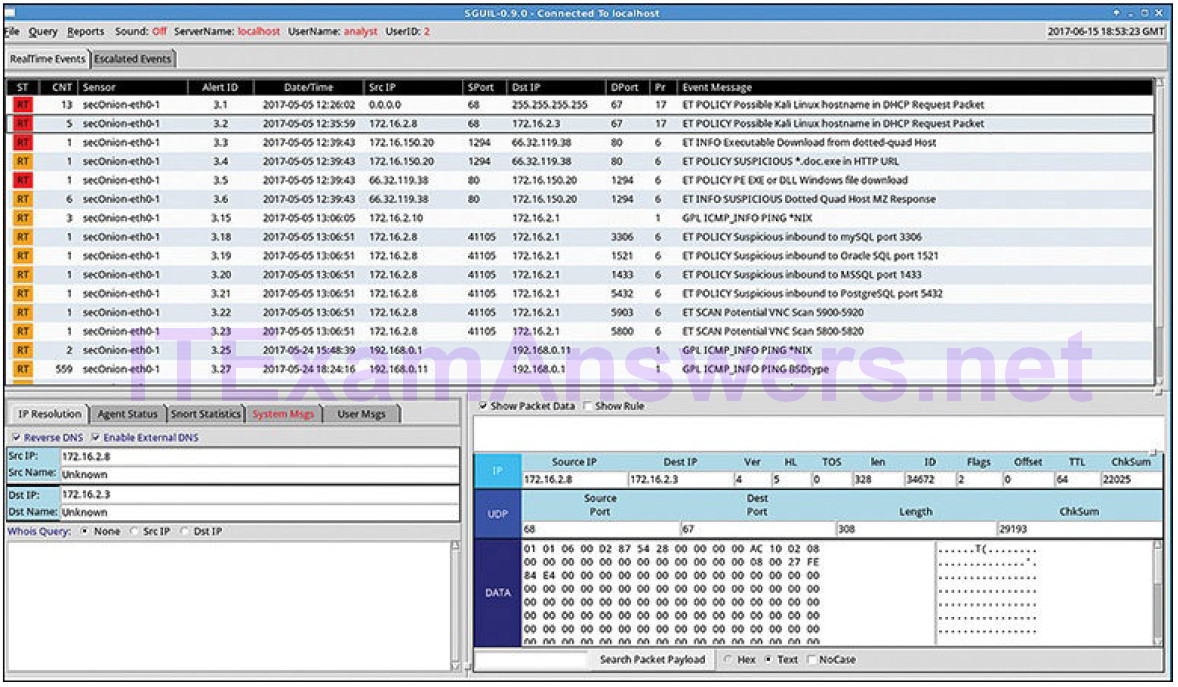
Figure 11-13 Sguil Console Showing Alert Event Data
Session and Transaction Data (11.2.1.2)
Session data is a record of a conversation between two network endpoints, often a client and a server. The server could be inside the enterprise network or at a location accessed over the Internet. Session data is data about the session, not the data retrieved and used by the client. Session data will include identifying information such as the five tuples of source and destination IP addresses, sourceand destination port numbers, and the IP code for the protocol in use. Data about the session typically includes a session ID, the amount of data transferred by source and destination, and information related to the duration of the session.
Bro is a network security monitoring tool you will use in labs later in the course. Figure 11-14 shows a partial output for three HTTP sessions from a Bro connection log.

Figure 11-14 Bro Session Data: Partial Display
The following describes each field in Figure 11-14:
1. session start timestamp in Unix epoch format
2. unique session ID
3. IP address of host originating the session (source address)
4. protocol port for the originating host (source port)
5. IP address of host responding to originating host (destination address)
6. protocol for responding host (destination port)
7. transport layer protocol for session
8. application layer protocol
9. duration of session
10. bytes from originating host
11. bytes from responding host
12. packets from originating host
13. packets from responding host
Transaction data consists of the messages that are exchanged during network sessions. These transactions can be viewed in packet capture transcripts. Device logs kept by servers also contain information about the transactions that occur between clients and servers. For example, a session might include the downloading of content from a web server, as shown in Figure 11-15. The transactions representing the requests and replies would be logged in an access log on the server or by a NIDS like Bro. The session is all traffic involved in making up the request, and the transaction is the request itself.
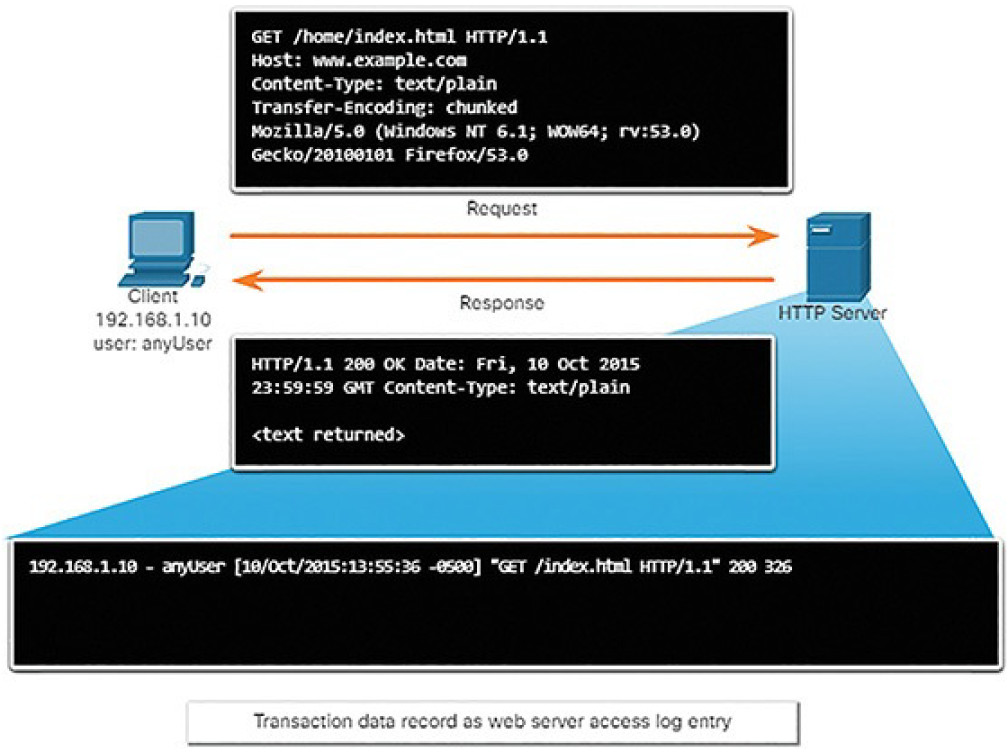
Figure 11-15 Transaction Data
Full Packet Captures (11.2.1.3)
Full packet captures are the most detailed network data that is generally collected. Because of the amount of detail, they are also the most storage- and retrieval-intensive types of data used in NSM. Full packet captures contain not only data about network conversations, such as session data, but also the actual contents of the conversations themselves. Full packet captures contain the text of email messages, the HTML in web pages, and the files that enter or leave the network. Extracted content can be recovered from full packet captures and analyzed for malware or user behavior that violates business and security policies. The familiar tool Wireshark is very popular for viewing full packet captures and accessing the data associated with network conversations.
Figure 11-16 illustrates the interface for the Network Analysis Monitor component of Cisco Prime Infrastructure system, which, like Wireshark, can display full packet captures.
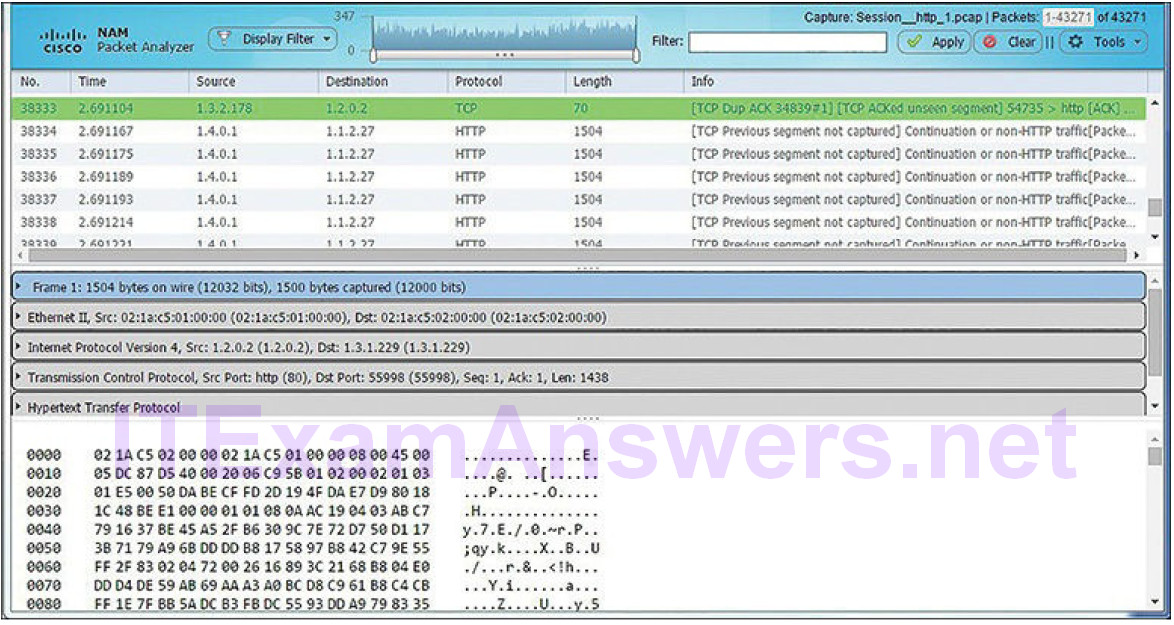
Figure 11-16 Cisco Prime Network Analysis Module: Full Packet Capture
Statistical Data (11.2.1.4)
Like session data, statistical data is about network traffic. Statistical data is created through the analysis of other forms of network data. From these analyses, conclusions can be made that describe or predict network behavior. Statistical characteristics of normal network behavior can be compared to current network traffic in an effort to detect anomalies. Statistics can be used to characterize normal amounts of variation in network traffic patterns in order to identify network conditions that are significantly outside of those ranges. Statistically significant differences should raise alarms and prompt investigation.
Network Behavior Analysis (NBA) and Network Behavior Anomaly Detection (NBAD) are approaches to network security monitoring that use advanced analytical techniques to analyze NetFlow or Internet Protocol Flow Information Export (IPFIX) network telemetry data. Techniques such as predictive analytics and artificial intelligence perform advanced analyses of detailed session data to detect potential security incidents.
Note
IPFIX is the open standard version of Cisco’s NetFlow.
An example of an NSM tool that utilizes statistical analysis is Cisco Cognitive Threat Analytics. It is able to find malicious activity that has bypassed security controls, or entered through unmonitored channels (including removable media), and is operating inside an organization’s environment. Cognitive Threat Analytics is a cloud-based product that uses machine learning and statistical modeling of networks. It creates a baseline of the traffic in a network and identifies anomalies. It analyzes user and device behavior, and web traffic, to discover command-and-control communications, data exfiltration, and potentially unwanted applications operating in the infrastructure. Figure 11-17 illustrates an architecture for Cisco Cognitive Threat Analytics.
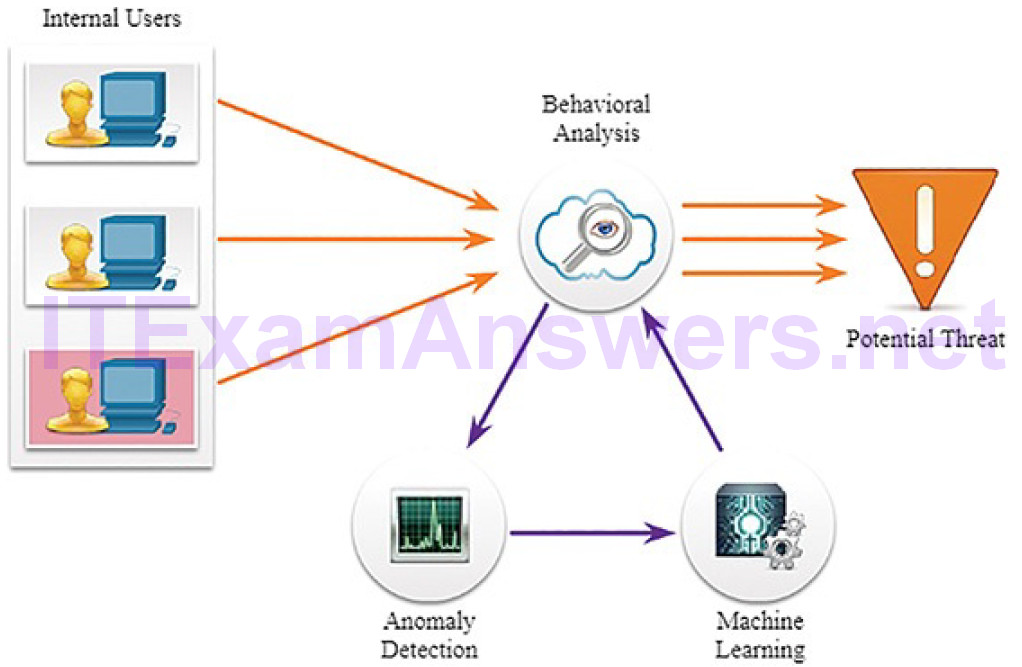
Figure 11-17 Cisco Cognitive Threat Analytics
Activity 11.2.1.5: Identify Types of Network Monitoring Data
Refer to the online course to complete this Activity.
End Device Logs (11.2.2)
In this topic, you will learn the elements of an end device log file.
Host Logs (11.2.2.1)
As previously discussed, host-based intrusion detection (HIDS) runs on individual hosts. HIDS not only detects intrusions, but, in the form of host-based firewalls, can also prevent intrusion. This software creates logs and stores them on the host. This can make it difficult to get a view of what is happening on hosts in the enterprise, so many host-based protections have a way to submit logs to centralized log management servers. In this way, the logs can be searched from a central location using NSM tools.
HIDS systems can use agents to submit logs to management servers. OSSEC, a popular open source HIDS, includes a robust log collection and analysis functionality. Microsoft Windows includes several methods for automated host log collection and analysis. Tripwire, a HIDS for Linux, includes similar functionality. All can scale to larger enterprises.
Microsoft Windows host logs are visible locally through Event Viewer. Event Viewer keeps four types of logs:
Application logs: These contain events logged by various applications.
System logs: These include events regarding the operation of drivers, processes, and hardware.
Setup logs: These record information about the installation of software, including Windows updates.
Security logs: These record events related to security, such as logon attempts and operations related to file or object management and access.
Various logs can have different event types. Table 11-1 lists the Windows host log event types.
Table 11-1 Windows Host Log Event Types
| Event Type | Description |
|---|---|
| Error | An event that indicates a significant problem such as loss of data or loss of functionality. For example, if a service fails to load during startup, an Error event is logged. |
| Warning | An event that is not necessarily significant, but may indicate a possible future problem. For example, when disk space is low, a Warning event is logged. If an application can recover from an event without loss of functionality or data, it can generally classify the event as a Warning event. |
| Information | An event that describes the successful operation of an application, driver, or service. For example, when a network driver loads successfully, it may be appropriate to log an Information event. Note that it is generally inappropriate for a desktop application to log an event each time it starts. |
| Success Audit | An event that records an audited security access attempt that is successful. For example, a user’s successful attempt to log on to the system is logged as a Success Audit event. |
| Failure Audit | An event that records an audited security access attempt that fails. For example, if a user tries to access a network drive and fails, the attempt is logged as a Failure Audit event. |
Security logs consist only of audit success or failure messages. On Windows computers, security logging is carried out by the Local Security Authority Subsystem Service (LSASS), which is also responsible for enforcing security policies on a Windows host. LSASS runs as lsass.exe. It is frequently faked by malware. It should be running from the Windows System32 directory. If a file with this name, or a camouflaged name, such as 1sass.exe, is running or running from another directory, it could be malware.
Syslog (11.2.2.2)
Syslog includes specifications for message formats, a client-server application structure, and network protocol. Many different types of network devices can be configured to use the syslog standard to log events to centralized syslog servers.
Syslog is a client/server protocol. Syslog was defined within the Syslog working group of the IETF (RFC 5424) and is supported by a wide variety of devices andreceivers across multiple platforms.
The syslog sender sends a small (less than 1 KB) text message to the syslog receiver. The syslog receiver is commonly called “syslogd,” “syslog daemon,” or “syslog server.” Syslog messages can be sent via UDP (port 514) and/or TCP (typically, port 5000). While there are some exceptions, such as SSL wrappers, this data is typically sent in plaintext over the network.
The full format of a syslog message seen on the wire has three distinct parts, as shown in Figure 11-18:
- PRI (priority)
- HEADER
- MSG (message text)

Figure 11-18 Syslog Packet Format
The PRI consists of two elements, the Facility and Severity of the message, which are both integer values, as shown in Figure 11-19.
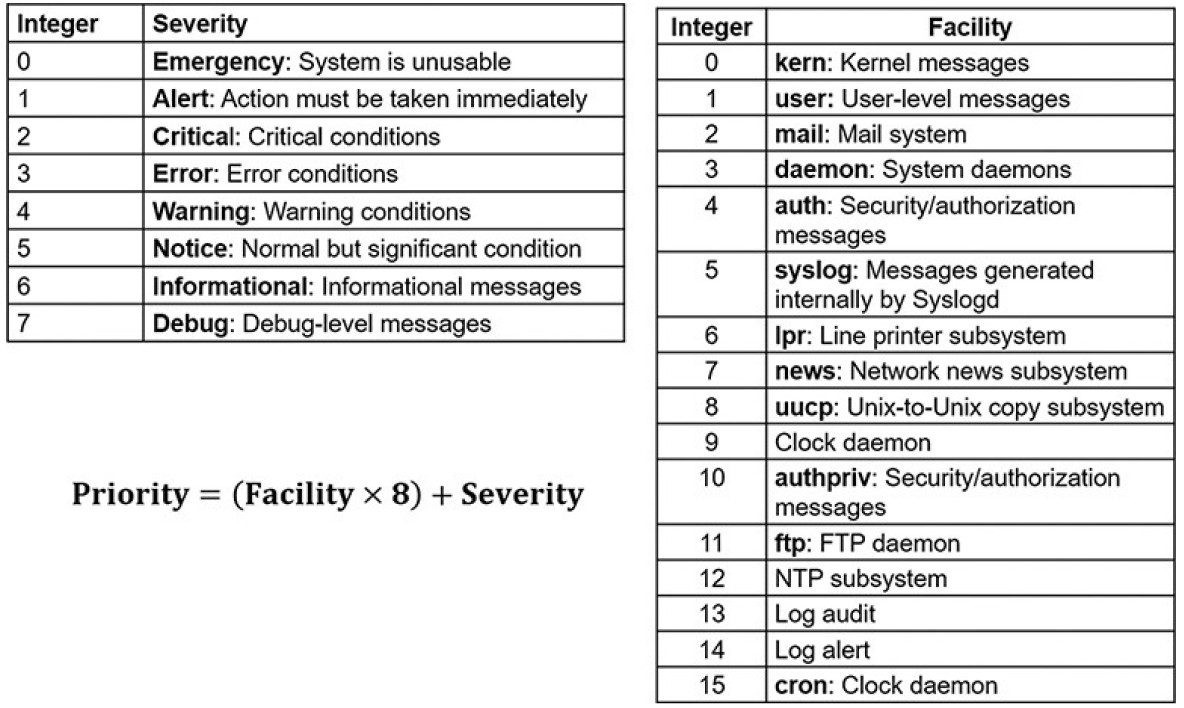
Figure 11-19 Syslog Severity and Facility
The Facility consists of broad categories of sources that generated the message, such as the system, process, or application. The Facility value can be used by logging servers to direct the message to the appropriate log file. The Severity is a value from 0 to 7 that defines the severity of the message. The Priority (PRI) value is calculated by multiplying the Facility value by 8, and then adding it to the Severity value:
Priority = (Facility * 8) + Severity
The Priority value is the first value in a packet and occurs between angle brackets (<>).
The HEADER section of the message contains the timestamp in MMM DD HH:MM:SS format. If the timestamp is preceded by the period (.) or asterisk (*) symbols, a problem is indicated with NTP. The HEADER section also includes the hostname or IP address of the device that is the source of the message.
The MSG portion contains the meaning of the syslog message. This can vary between device manufacturers and can be customized. Therefore, this portion of the message is the most meaningful and useful to the cybersecurity analyst.
Server Logs (11.2.2.3)
Server logs are an essential source of data for network security monitoring. Network application servers such as email and web servers keep access and error logs. Especially important are DNS proxy server logs, which document all the DNS queries and responses that occur on the network. DNS proxy logs are useful for identifying hosts that may have visited dangerous websites and for identifying DNS data exfiltration and connections to malware command-and-control servers. Many UNIX and Linux servers use syslog. Others may use proprietary logging. The contents of log file events depend on the type of server.
Two important log files to be familiar with are the Apache HTTP Server access logs and Microsoft Internet Information Services (IIS) access logs. Examples of each are shown in Example 11-3 and Example 11-4.
Example 11-3 Apache Access Log
203.0.113.127 – dsmith [10/Oct/2016:10:26:57 -0500] "GET /logo_sm.gif
HTTP/1.0"
200 2254 ""http://www.example.com/links.html"" "Mozilla/5.0 (Windows
NT 6.1;
Win64; x64; rv:47.0) Gecko/20100101 Firefox/47.0"
Example 11-4 IIS Access Log
6/14/2016, 16:22:43, 203.0.113.24, -, W3SVC2, WEB3, 198.51.100.10,
80, GET, /home.
htm, -, 200, 0, 15321, 159, 15, HTTP/1.1, Mozilla/5.0 (compatible;
MSIE 9.0;
Windows Phone OS 7.5; Trident/5.0; IEMobile/9.0), -,
http://www.example.com
Apache HTTP Server Access Logs (11.2.2.4)
Apache HTTP Server access logs record the requests for resources from clients to the server. The logs can be in two formats. The first is common log format(CLF), and the second is combined log format, which is CLF with the addition of the Referrer and User Agent fields, as shown in the figure.
The fields in the Apache access log (Example 11-3) in CLF are as follows:
IP address of requesting host: In Example 11-3, the address is 203.0.113.127.
Identity of client: This is unreliable, and is frequently replaced by the hyphen (-) placeholder, which is used to represent missing or unavailable data.
User ID: If the user is authenticated to the web server, this is the username for the account. Much access to web servers is anonymous, so this value will frequently be replaced by a hyphen.
Timestamp: The time the request was received in DD/MMM/YYYY:HH:MM:SS (+|-) zone format.
Request: The request method, the requested resource, and the request protocol.
Status code: Three-digit numeric code representing the status of request.
Codes beginning with 2 represent success, such as the 200 in Example 11-3.
Codes that begin with a 3 represent redirection. Codes that begin with a 4 represent client errors. Codes that begin with a 5 represent server errors.
Size of the response: Size, in bytes, of data returned to the client.
The combined log format adds the following two fields:
Referrer: The URL of the resource from which the request was made. If the request is made directly by the user typing the URL into the browser, from a bookmark, or from a URL in a document, the value will normally be a hyphen.
User agent: The identifier for the browser that made the request.
Table 11-2 identifies the value of each field in Example 11-3.
Table 11-2 Apache Access Log Entry Explanation
| Field | Name | Description | Example |
|---|---|---|---|
| 1 | Client IP Address | IP address of requesting client | 203.0.113.127 |
| 2 | Client Identity | Client userid, frequently omitted | – |
| 3 | User ID | Username of authenticated user, if any | dsmith |
| 4 | Timestamp | Date and time of request | [10/Oct/2016:10:26:57 -0500] |
| 5 | Request | Request method and requested resource | GET /logo_sm.gif HTTP/1.0 |
| 6 | Status Code | HTTP status code | 200 |
| 7 | Size of Response | Bytes returned to client | 2254 |
| 8 | Referrer | Location, if any, from which the client reached the resource | http://www.example.com/links.html |
| 9 | User Agent | Browser used by client | Mozilla/5.0 (Windows NT 6.1; Win64; x64; rv:47.0) Gecko/20100101 Firefox/47.0 |
Note
The terms Uniform Resource Identifier (URI) and Uniform Resource Locator (URL) are not the same. A URI is a compact method of referring to a source such as example.com. A URL specifies the method for accessing the resource,such as https://www.example.com or ftp://www.example.com.
IIS Access Logs (11.2.2.5)
Microsoft IIS creates access logs that can be viewed from the server with Event Viewer. Event Viewer makes viewing the native IIS log format much easier. An explanation of each field in Example 11-4 is provided in Table 11-3. The native IIS log format is not customizable. However, IIS can log in more standard formats such as W3C Extended format, which does allow customization.
Table 11-3 IIS Access Log Entry Explanation
| Item | Field | Explanation | Example |
|---|---|---|---|
| Date | date | Date on which the activity occurred | 6/14/2016 |
| Time | time | UTC time at which the activity occurred | 16:22:22 |
| Client IP Address | c-ip | IP address of the client that made the request | 203.0.113.24 |
| User Name | cs-username | Authenticated username | – |
| Service Name and Instance Number | s-sitename | Internet service name and instance number | W3SVC2 |
| Server Name | s-computername | Name of the server that generated the log entry | WEB3 |
| Server IP Address | s-ip | IP address of the server | 198.51.100.10 |
| Server Port | s-port | Server port for the service | 80 |
| Method | cs-method | Requested action (HTTP method) | GET |
| URI Stem | cs-uri-stem | Target of the action | /home.htm |
| URI Query | cs-uri-query | The query the client was trying to perform | – |
| HTTP Status | sc-status | HTTP status code | 200 |
| Win32 Status | sc-win32-status | Windows status code | 0 |
| Bytes Sent | sc-bytes | Bytes that the server sent | 15321 |
| Bytes Received | cs-bytes | Bytes that the server received | 159 |
| Time Taken | time-taken | Length of time that the action took, in milliseconds | 15 |
| Protocol Version | cs-version | The protocol version | HTTP/1.1 |
| User Agent | cs(User-Agent) | Browser type that the client used | Mozilla/5.0 (compatible; MSIE 9.0; Windows Phone OS 7.5; Trident/5.0;IEMobile/9.0) |
| Cookie | cs(Cookie) | The content of the cookie sent or received, if any | – |
| Referrer | cs(Referrer) | Site that provided a link to the current site | http://www.example.com |
SIEM and Log Collection (11.2.2.6)
Security Information and Event Management (SIEM) technology is used in many organizations to provide real-time reporting and long-term analysis of security events, as shown in Figure 11-20.
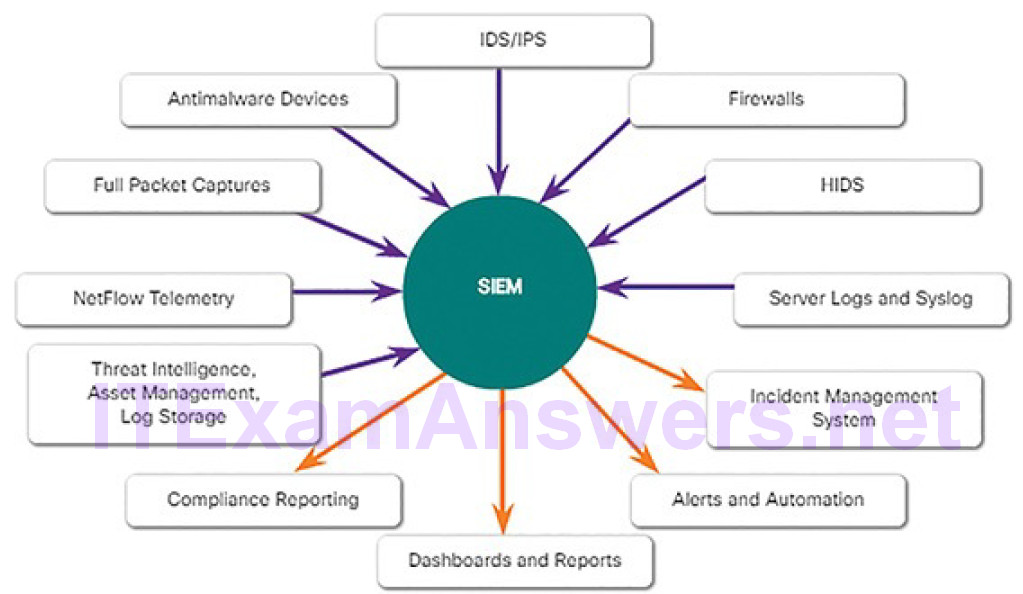
Figure 11-20 SIEM Components
SIEM combines the essential functions of security event management (SEM) and security information management (SIM) tools to provide a comprehensiveview of the enterprise network using the following functions:
Log collection: These event records from sources throughout the organization provide important forensic information and help to address compliance reporting requirements.
Normalization: This maps log messages from different systems into a common data model, enabling the organization to connect and analyze related events, even if they are initially logged in different source formats.
Correlation: This links logs and events from disparate systems or applications, speeding detection of and reaction to security threats.
Aggregation: This reduces the volume of event data by consolidating duplicate event records.
Reporting: This presents the correlated, aggregated event data in real-time monitoring and long-term summaries, including graphical interactive dashboards.
Compliance: This is reporting to satisfy the requirements of various compliance regulations.
A popular SIEM is Splunk, which is made by a Cisco partner. Figure 11-21 shows the Splunk Botnet Dashboard. Splunk is widely used in SOCs. Another popular and open source SIEM solution is ELK, which consists of the integrated Elasticsearch, Logstash, and Kibana applications.
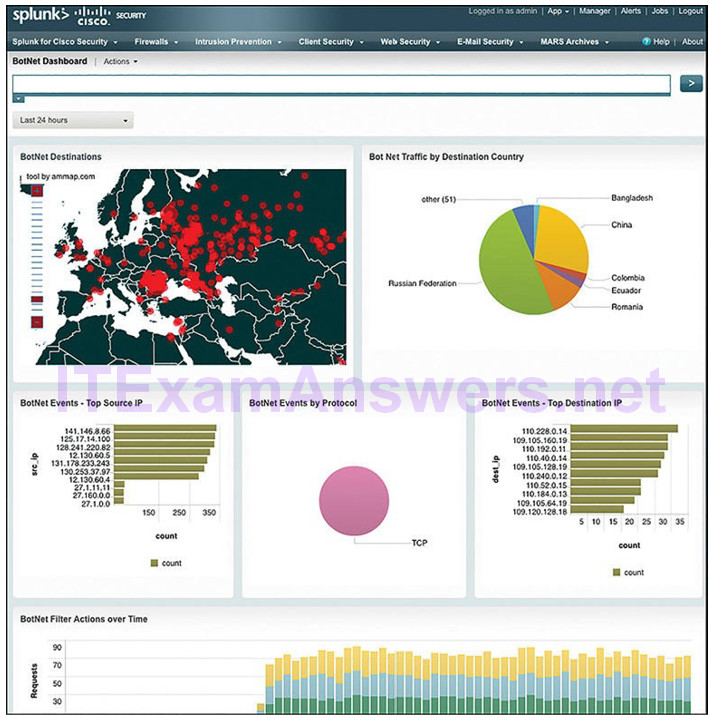
Figure 11-21 Splunk Botnet Dashboard
Activity 11.2.2.7: Identify Information in Logged Events
Refer to the online course to complete this Activity.
Network Logs (11.2.3)
In this topic, you will learn the elements of a network device log file.
Tcpdump (11.2.3.1)
The tcpdump command line tool is a very popular packet analyzer. It can display packet captures in real time or write packet captures to a file. It captures detailed packet protocol and content data. Wireshark is a GUI built on tcpdump functionality.
The structure of tcpdump captures varies depending on the protocol captured and the fields requested.
NetFlow (11.2.3.2)
NetFlow is a protocol that was developed by Cisco as a tool for network troubleshooting and session-based accounting. NetFlow efficiently provides an important set of services for IP applications, including network traffic accounting, usage-based network billing, network planning, security, denial of service monitoring capabilities, and network monitoring. NetFlow provides valuable information about network users and applications, peak usage times, and traffic routing.
NetFlow does not capture the entire contents of a packet as does full packet capture. Instead, NetFlow records information about the packet flow. For example, a full packet capture is viewed in Wireshark or tcpdump. NetFlow collects metadata, or data about the flow, not the flow data itself.
Cisco invented NetFlow and then allowed it to be used as a basis for an IETF standard called IPFIX. IPFIX is based on Cisco NetFlow Version 9.
NetFlow information can be viewed with tools such as the nfdump tool. Similar to tcpdump, nfdump provides a command line utility for viewing NetFlow data from the nfcapd capture daemon, or collector. Tools exist that add GUI functionality to viewing flows. Figure 11-22 shows a screen from the open source FlowViewer tool. The Cisco/Lancope StealthWatch technology enhances the use of NetFlow data for NSM.
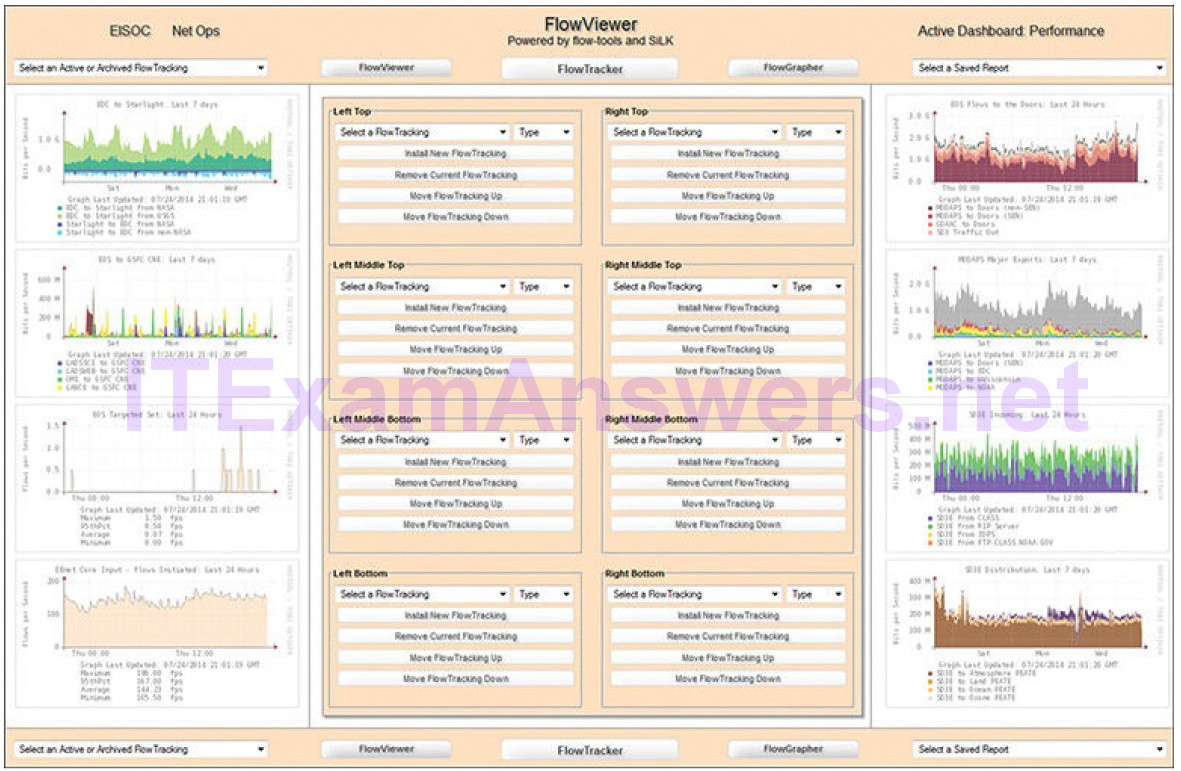
Figure 11-22 NetFlow Session Data Dashboard: FlowViewer
Traditionally, an IP flow is based on a set of five, and up to seven, IP packet attributes flowing in a single direction. A flow consists of all packets transmitted until the TCP conversation terminates. IP packet attributes used by NetFlow are:
- IP source address
- IP destination address
- Source port
- Destination port
- Layer 3 protocol type
- Class of service
- Router or switch interface
All packets with the same source/destination IP address, source/destination ports, protocol interface, and class of service are grouped into a flow, and then packets and bytes are tallied. This methodology of fingerprinting or determining a flowis scalable because a large amount of network information is condensed into a database of NetFlow information called the NetFlow cache.
All NetFlow flow records will contain the first five items in the preceding list and flow start and end timestamps. The additional information that may appear is highly variable and can be configured on the NetFlow exporter. Exporters are devices that can be configured to create flow records and transmit those flow records for storage on a NetFlow collector device. An example of a basic NetFlow flow record, in two different presentations, is shown in Example 11-5.
Example 11-5 Simple NetFlow Version 5 Flow Record
Traffic Contribution: 8% (3/37)

Flow information:
IPV4 SOURCE ADDRESS: 10.1.1.2
IPV4 DESTINATION ADDRESS: 13.1.1.2
INTERFACE INPUT: Se0/0/1
TRNS SOURCE PORT: 8974
TRNS DESTINATION PORT: 80
IP TOS: 0x00
IP PROTOCOL: 6
FLOW SAMPLER ID: 0
FLOW DIRECTION: Input
ipv4 source mask: /0
ipv4 destination mask: /8
counter bytes: 205
ipv4 next hop address: 13.1.1.2
tcp flags: 0x1b
interface output: Fa0/0
counter packets: 5
timestamp first: 00:09:12.596
timestamp last: 00:09:12.606
ip source as: 0
ip destination as: 0
A large number of attributes for a flow are available. The IANA registry of IPFIX entities lists several hundred, with the first 128 being the most common.Although NetFlow was not initially conceived as tool for network security monitoring, it is seen as a useful tool in the analysis of network security incidents. It can be used to construct a timeline of compromise, understand individual host behavior, or to track the movement of an attacker or exploit from host to host within a network.
Application Visibility and Control (11.2.3.3)
The Cisco Application Visibility and Control (AVC) system, depicted in Figure 11-23, combines multiple technologies to recognize, analyze, and control over 1000 applications. These include voice and video, email, file sharing, gaming, peer-to-peer (P2P), and cloud-based applications. AVC uses Cisco Next-Generation Network-Based Application Recognition (NBAR2) to discover and classify the applications in use on the network. The NBAR2 application recognition engine supports over 1000 network applications.
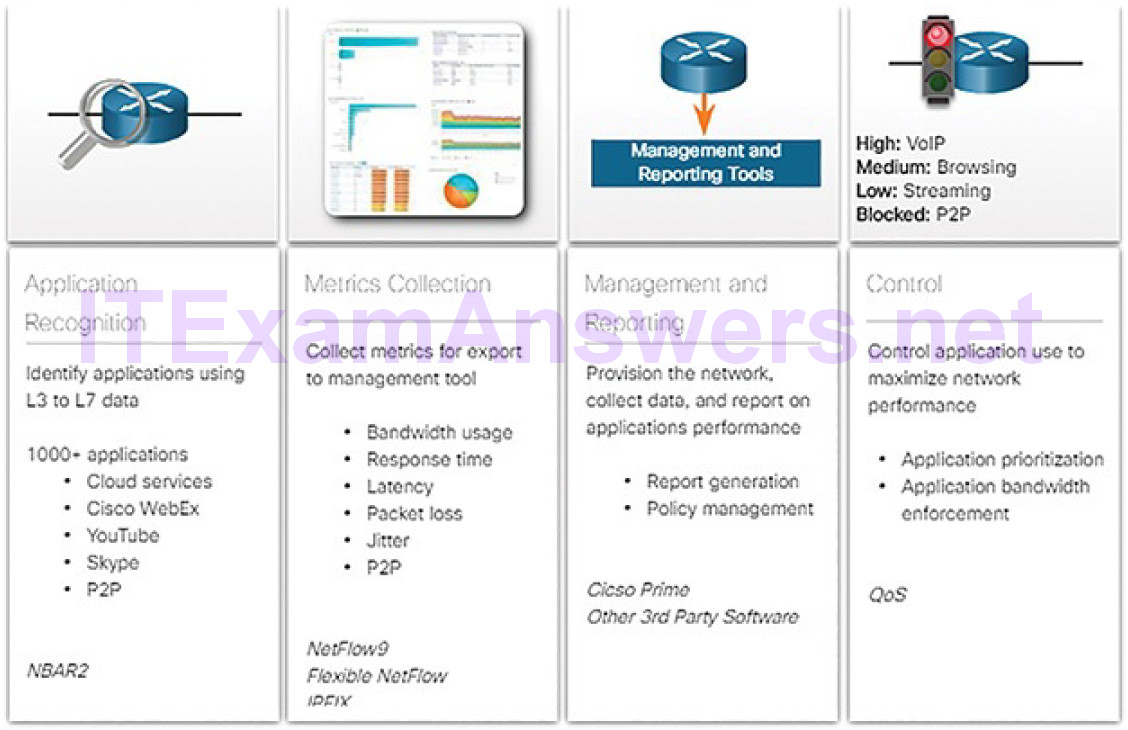
Figure 11-23 Cisco Application Visibility and Control
To truly understand the importance of this technology, consider Figure 11-24.
Identification of network applications by port provides very little granularity and visibility into user behavior. However, application visibility through the identification of application signatures identifies what users are doing, whether it be teleconferencing or downloading movies to their phones.
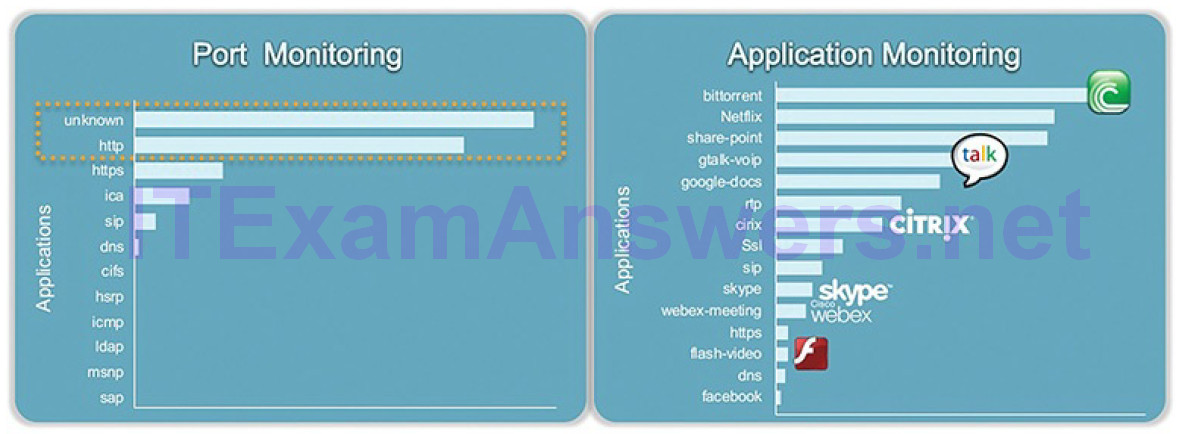
Figure 11-24 Cisco Application Visibility and Control Example
A management and reporting system, such as Cisco Prime, analyzes and presents the application analysis data into dashboard reports for use by network monitoring personnel. Application usage can also be controlled through quality of service classification and policies based on the AVC information.
Content Filter Logs (11.2.3.4)
Devices that provide content filtering, such as the Cisco Email Security Appliance (ESA) and the Cisco Web Security Appliance (WSA), provide a wide range of functionalities for security monitoring. Logging is available for many of these functionalities.
The ESA, for example, has more than 30 logs that can be used to monitor most aspects of email delivery, system functioning, antivirus, antispam operations, and blacklist and whitelist decisions. Most of the logs are stored in text files and can be collected on syslog servers, or can be pushed to FTP or SCP servers. In addition, alerts regarding the functioning of the appliance itself and its subsystems can be monitored by email to administrators who are responsible formonitoring and operating the device.
WSA devices offer a similar depth of functioning. WSA effectively acts as a web proxy, meaning that it logs all inbound and outbound transaction information for HTTP traffic. These logs can be quite detailed and are customizable. They can be configured in a W3C compatibility format. The WSA can be configured to submit the logs to a server in various ways, including syslog, FTP, and SCP.
Other logs that are available to the WSA include ACL decision logs, malware scan logs, and web reputation filtering logs.
Figure 11-25 illustrates the “drill-down” dashboards available from Cisco content filtering devices.
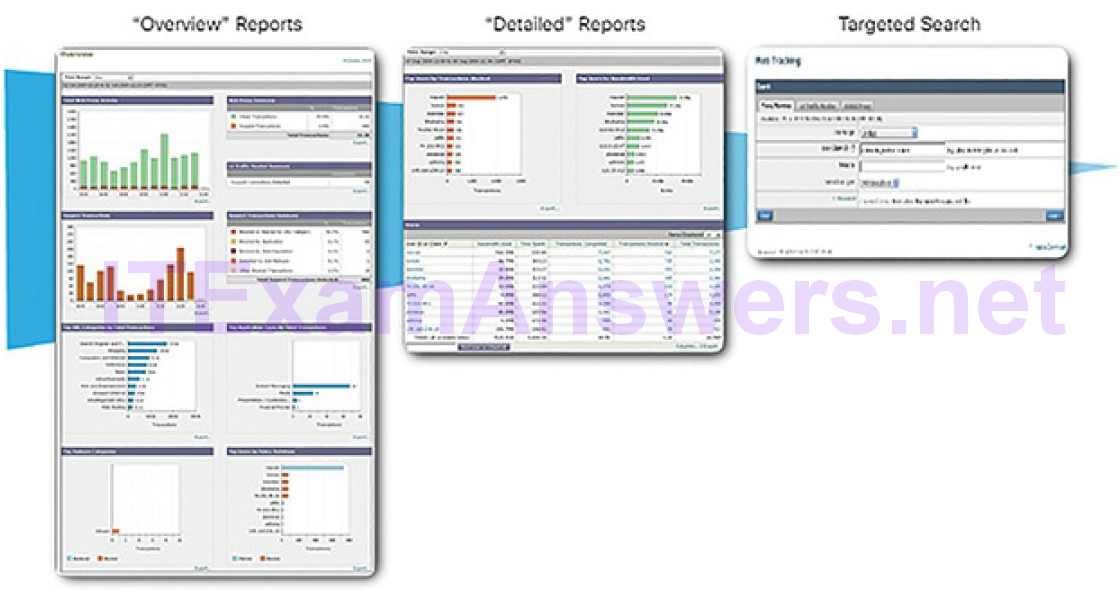
Figure 11-25 Cisco Content Filtering Dashboards
Logging from Cisco Devices (11.2.3.5)
Cisco security devices can be configured to submit events and alerts to security management platforms using SNMP or syslog. Figure 11-26 illustrates a syslog message generated by a Cisco ASA device and a syslog message generated by a Cisco IOS device.
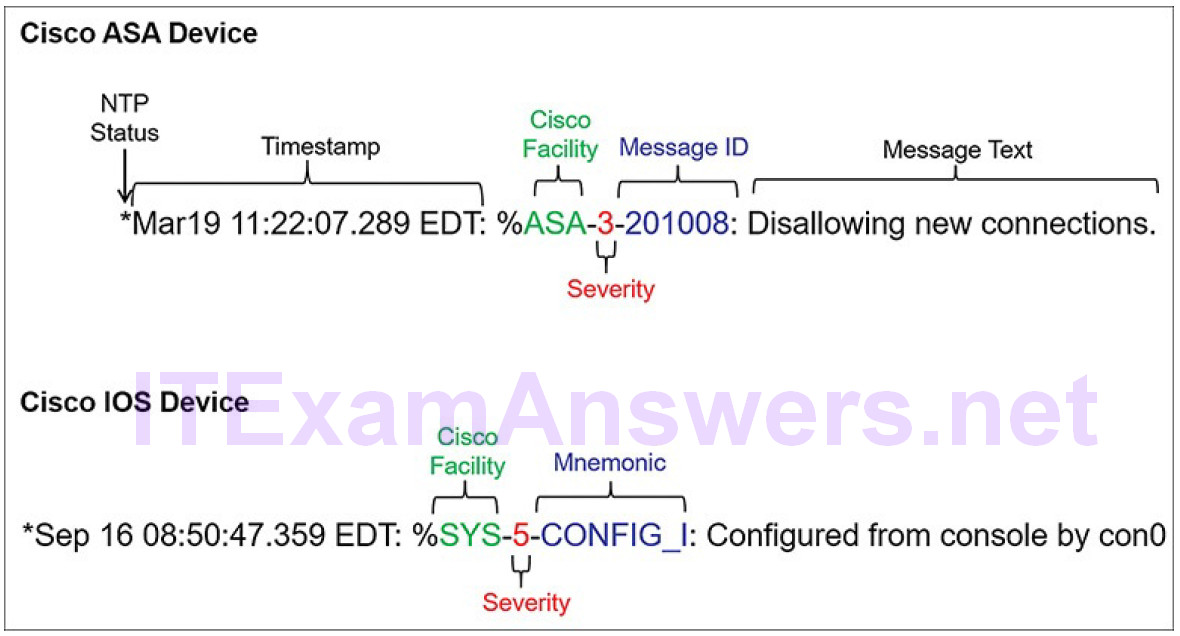
Figure 11-26 Cisco Syslog Message Formats
Note that there are two meanings used for the term Facility in Cisco syslog messages. The first is the standard set of Facility values that were established by the syslog standards. These values are used in the PRI message part of the syslog packet to calculate the message priority. Cisco uses some of the values between 15 and 23 to identify Cisco log Facilities, depending on the platform. For example, Cisco ASA devices use syslog Facility 20 by default, which corresponds to local4. The other Facility value is assigned by Cisco, and occurs in the MSG part of the syslog message.
Cisco devices may use slightly different syslog message formats, and may use mnemonics instead of message IDs, as shown in Figure 11-26.
Proxy Logs (11.2.3.6)
Proxy servers, such as those used for web and DNS requests, contain valuable logs that are a primary source of data for network security monitoring.
Proxy servers are devices that act as intermediaries for network clients. For example, an enterprise may configure a web proxy to handle web requests on the behalf of clients. Instead of requests for web resources being sent directly to the server from the client, the request is sent to a proxy server first. The proxy serverrequests the resources and returns them to the client. The proxy server generates logs of all requests and responses. These logs can then be analyzed to determine which hosts are making the requests, to assess whether the destinations are safe or potentially malicious, and to gain insights into the kind of resources that have been downloaded.
Web Proxies
Web proxies provide data that help determine whether responses from the web were generated in response to legitimate requests or have been manipulated to appear to be responses but are in fact exploits. It is also possible to use web proxies to inspect outgoing traffic as a means of data loss prevention (DLP).
DLP involves scanning outgoing traffic to detect whether the data that is leaving the web contains sensitive, confidential, or secret information. Examples of popular web proxies are Squid, CCProxy, Apache Traffic Server, and WinGate.
Example 11-6 illustrates an example of a Squid web proxy log in the Squid-native format. Explanations of the field values are provided in Table 11-4.
Example 11-6 Squid Web Proxy Log: Native Format
1265939281.764 19478 172.16.167.228 TCP_MISS/200 864 GET
http://www.example.com//
images/home.png - NONE/- image/png
Table 11-4 Squid Web Proxy Log Explanation
| Field | Description |
|---|---|
| 1265939282 | Time: In UNIX epoch timestamp format, with milliseconds |
| 19478 | Duration: The elapsed time received, request, and response from Squid |
| 172.16.31.7 | Client IP address: The IP address of the client that made the request |
| TCP_MISS/200 | Result codes: Squid result code and HTTP status code separated by a slash |
| 864 | Size in bytes: The size/amount of data delivered to client |
| GET | Request method: Request method made by client |
| http://www.example.com//images/home.png | URI/URL: Address of requested resource |
| – | Client identity: RFC 1413 value of the client that made the request; not used by default |
| NONE/- | Peering code/peer host: Neighbor cache server consulted |
| image/png | Type: MIME content type from Content-Type value in the response HTTP header |
Note
Open web proxies, which are proxies that are available to any Internet user, canbe used to obfuscate threat actor IP addresses. Open proxy addresses may be used in blacklisting Internet traffic.
OpenDNS
OpenDNS, a Cisco company, offers a hosted DNS service that extends the capability of DNS to include security enhancements. Rather than organizations hosting and maintaining blacklisting, phishing protection, and other DNS-related security, OpenDNS provides these protections on their own DNS service.
OpenDNS is able to apply many more resources to managing DNS than most organizations can afford. OpenDNS functions in part as a DNS super proxy in this regard. The OpenDNS suite of security products apply real-time threat intelligence to managing DNS access and the security of DNS records. DNS access logs are available from OpenDNS for the subscribed enterprise. Example 11-7 shows an example of an OpenDNS proxy log. Table 11-5 has an explanation of each field. Instead of using local or ISP DNS servers, an organization can choose to subscribe to OpenDNS for DNS services.
Example 11-7 OpenDNS Web Proxy Log
| Field | Example | Explanation |
|---|---|---|
| Timestamp | @40000000573b4e1a11876764 | Log file entry timestamp in TAI64N format |
| Version | 9.2 | Version of the log format |
| remoteIP | 192.168.1.11 | Address of original requestor, same as the client address if no proxy is involved |
| client | 192.168.1.11 | Client address |
| server | 203.0.113.200 | DNS server IP address |
| handling | normal | Normal operation or other action such as redirection, blocking, etc. |
| origin_id | 0 | Device ID that applied policy |
| other origin IDs | – | List of additional origin devices |
| qname | www.example.com | Resource queried |
| qtype | 1 | Type of query |
| rcode | 0 | Response code |
| dlink | 18e7e3b69b | Device ID |
| blocked categories | 0 | Associated category that resulted in blocking of request |
| categories | 8000000 | Category or request resource |
| flags | 0 | Transaction-specific flags for the stats system |
| public suffix | com | Top-level domain suffix |
| host | m6.dfw | First two components of hostname that generated log entry |
NextGen IPS (11.2.3.7)
NextGen IPS (NGIPS) devices extend network security beyond IP addresses and Layer 4 port numbers to the application layer and beyond. NextGen IPS devices are advanced devices that provided much more functionality than previous generations of network security devices. One of those functionalities is reportingdashboards with interactive features that allow quick point-and-click reports on very specific information without the need for SIEM or other event correlators.
Features of Cisco’s line of NGIPS devices is shown in Figure 11-27.
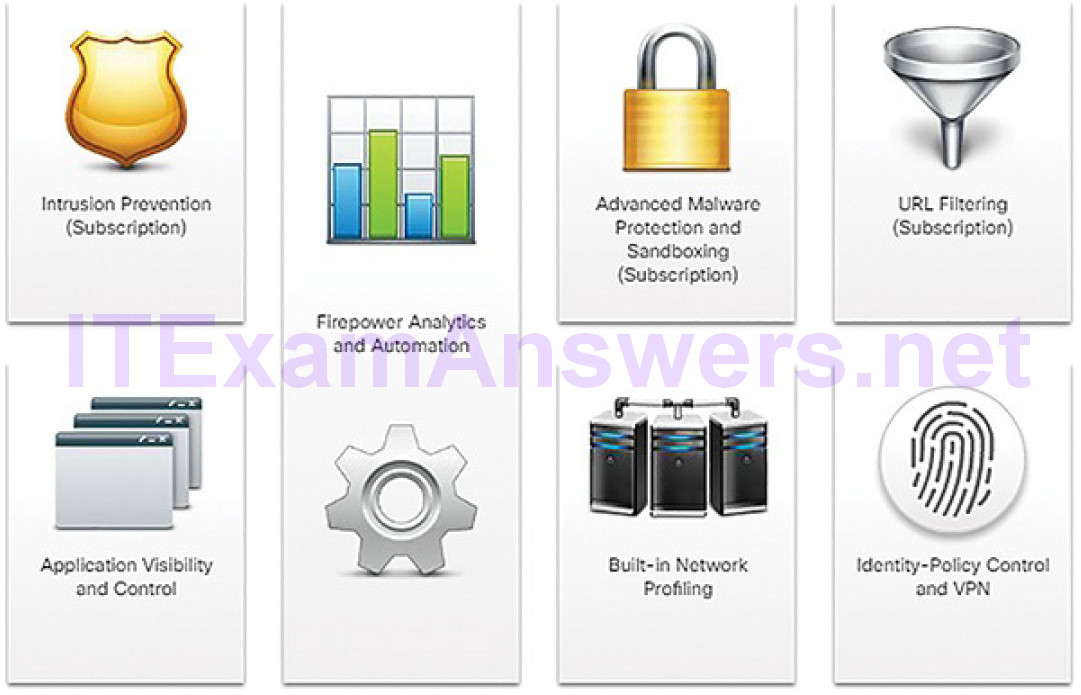
Figure 11-27 Cisco Next-Generation IPS Major Functionalities
Cisco NGIPSs use FirePOWER services to consolidate multiple security layers into a single platform. This helps to contain costs and simplify management. FirePOWER services include application visibility and control, FirePOWER NGIPS, reputation- and category-based URL filtering, and Advanced Malware Protection (AMP). FirePOWER devices allow monitoring network security through a web-enabled GUI called Event Viewer.
Common NGIPS events include:
Connection events: Connection logs contain data about sessions that are detected directly by the NGIPS. Connection events include basic connection properties such as timestamps, source and destination IP addresses, and metadata about why the connection was logged, such as which access control rule logged the event.
Intrusion events: The system examines the packets that traverse the network for malicious activity that could affect the availability, integrity, and confidentiality of a host and its data. When the system identifies a possible intrusion, it generates an intrusion event, which is a record of the date, time, type of exploit, and contextual information about the source of the attack and its target.
Host or endpoint events: When a host appears on the network, the system can detect it and log details of the device hardware, IP addressing, and the last known presence on the network.
Network discovery events: Network discovery events represent changes that have been detected in the monitored network. These changes are logged in response to network discovery policies that specify the kinds of data to be collected, the network segments to be monitored, and the hardware interfaces of the device that should be used for event collection.
NetFlow events: Network discovery can use a number of mechanisms, one of which is to use exported NetFlow flow records to generate new events for hosts and servers.
Activity 11.2.3.8: Identify the Security Technology from the Data Description
Refer to the online course to complete this Activity.
Activity 11.2.3.9: Identify the NextGen IPS Event Type
Refer to the online course to complete this Activity.
Packet Tracer 11.2.3.10: Explore a NetFlow Implementation
In this Packet Tracer activity, you will explore an implementation of NetFlow.
Packet Tracer 11.2.3.11: Logging from Multiple Sources
In this activity, you will use Packet Tracer to compare network data generated by multiple sources including syslog, AAA, and NetFlow.
Summary (11.3)
In this chapter, you learned how cybersecurity analysts use various tools and techniques to identify network security alerts. Syslog is a common monitoring protocol that can log a variety of events. NTP is used to timestamp these events. Protocols that are particularly vulnerable, such as DNS, HTTP, email protocols, and ICMP, should be actively monitored by the cybersecurity analyst.
Security technologies used to protect the privacy of our data also make it more difficult for security monitoring. ACLs can give a false sense of security if they are overly relied upon. NAT and PAT can complicate security monitoring, hiding the individual IP addresses that are inside the network. Encrypted traffic is difficult to monitor because the data is unreadable to any other devices but the VPN endpoints. P2P network activity can circumvent firewall protections, is difficult to monitor, and is a common vector for the spread of malware.
Log files are the data used by cybersecurity analysts to monitor the security of the network. Security data includes:
- Alert data
- Session and transaction data
- Full packet captures
- Statistical data
The sources for these security data include a variety of logs:
- Host logs
- Syslog
- Server logs
- Web logs
- Network logs
Lab 11.3.1.1: Set Up a Multi-VM Environment
In this lab, you will set up a virtual network environment by connecting multiple virtual machines in VirtualBox. This environment will be used for the rest of the labs in this course.
Practice
The following activities provide practice with the topics introduced in this chapter. The Labs and are available in the companion CCNA Cybersecurity Operations Lab Manual (ISBN: 9781587134388). The Packet Tracer Activity instructions are also in the Labs & Study Guide. The PKA files are found in the online course.
Labs
Lab 11.3.1.1: Set Up a Multi-VM Environment
Packet Tracer Activities
Packet Tracer 11.2.3.10: Explore a NetFlow Implementation
Packet Tracer 11.2.3.11: Logging from Multiple Sources
