6.7.2 Packet Tracer – Examining ICMP Packets Answers
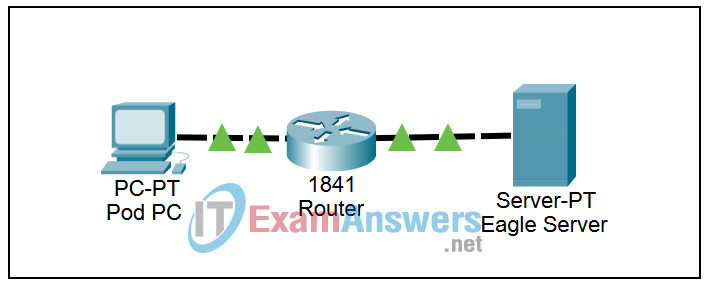
Topology

Addressing Table
This activity does not include an addressing table.
Learning Objectives
- Understand the format of ICMP packets
- Use Packet Tracer to capture and examine ICMP messages
Introduction:
Wireshark provides the ability to capture and display all of the network traffic entering and leaving the PC on which it is installed, through a network interface. Simulation mode in Packet Tracer captures all network traffic flowing through the entire network, but only supports a limited number of protocols. To come as close as possible to approximating Lab 6.7.2, we will use a network consisting of a PC that is connected to a server through a single router, and capture the output of various ping commands from the PC.
Task 1: Use Packet Tracer to capture and examine ICMP messages.
Step 1. Capture and evaluate ICMP echo messages to Eagle Server.
Enter Simulation mode. The Event List Filters is set to display only ICMP events. Click on the Pod PC. Open the Command Prompt from the Desktop. Enter the command ping eagle-server.example.com and press the Enter key. Minimize the Pod PC configuration window. Click the Auto Capture / Play button to run the simulation and capture events. Click OK when the “No More Events” message is reached.
Find the first packet in the Event List, this is the first echo request, and click on the colored square in the Info column. The PDU Information window opens when you click on the Info square for a packet in the event list. Click the Outbound PDU Details tab to view the content of the ICMP message. Note that Packet Tracer displays only the TYPE and CODE fields.
To simulate the operation of Wireshark, click on the colored square in the Info column for the next event where the At Device is shown as Pod PC. This is the first echo reply. Click the Inbound PDU Details tab to view the content of the ICMP message.
View the remainder of the events where the At Device is Pod PC. Click the Reset Simulation button when finished.
Step 2. Capture and evaluate ICMP echo messages to 192.168.253.1.
Repeat Step 1 using IP address 192.168.253.1. Watch the animation and notice which devices are involved in the exchange.
Step 3. Capture and evaluate ICMP echo messages that exceed the TTL value.
Packet Tracer does not support the ping -i option. We can set the TTL in Simulation mode by using the Add Complex PDU button (the open envelope).
Click the Add Complex PDU button, then click on Pod PC (the source). The Create Complex PDU dialog box opens. Enter 192.168.254.254 into the Destination IP Address: field. Change the value in the TTL: field to 1. Enter 1 into the Sequence Number field. Select the Periodic option under Simulation Settings. Enter 2 into the Interval field. Click the Create PDU button. This is equivalent to issuing the command ping -t -i 1 192.168.254.254 from the command prompt on Pod PC.
Click the Capture / Forward button repeatedly to generate several exchanges between Pod PC and the router.
Find the first packet in the Event List. This is the first echo request. Click on the colored square in the Info column. When you click on the Info square for a packet in the event list the PDU Information window opens. Click the Outbound PDU Details tab to view the content of the ICMP message.
To simulate the operation of Wireshark, click on the colored square in the Info column for the next event where the At Device is Pod PC. This is the first echo reply. Click the Inbound PDU Details tab to view the content of the ICMP message.
View the remainder of the events where the At Device is Pod PC.
